Ask how big a customer’s MES customization is and you get a shrug, a gut feeling or a spreadsheet that went stale two releases ago. That makes estimating, upgrades and governance guesswork.
We built cmf audit, a plugin for the CM CLI, to replace the shrug with numbers. It reads a project the way a build does, counts what it finds per package type, and posts the result as telemetry to the MES itself. It descends from the plugin approach in Anatomy of a Script, but this post is about what it measures, not how plugins work.
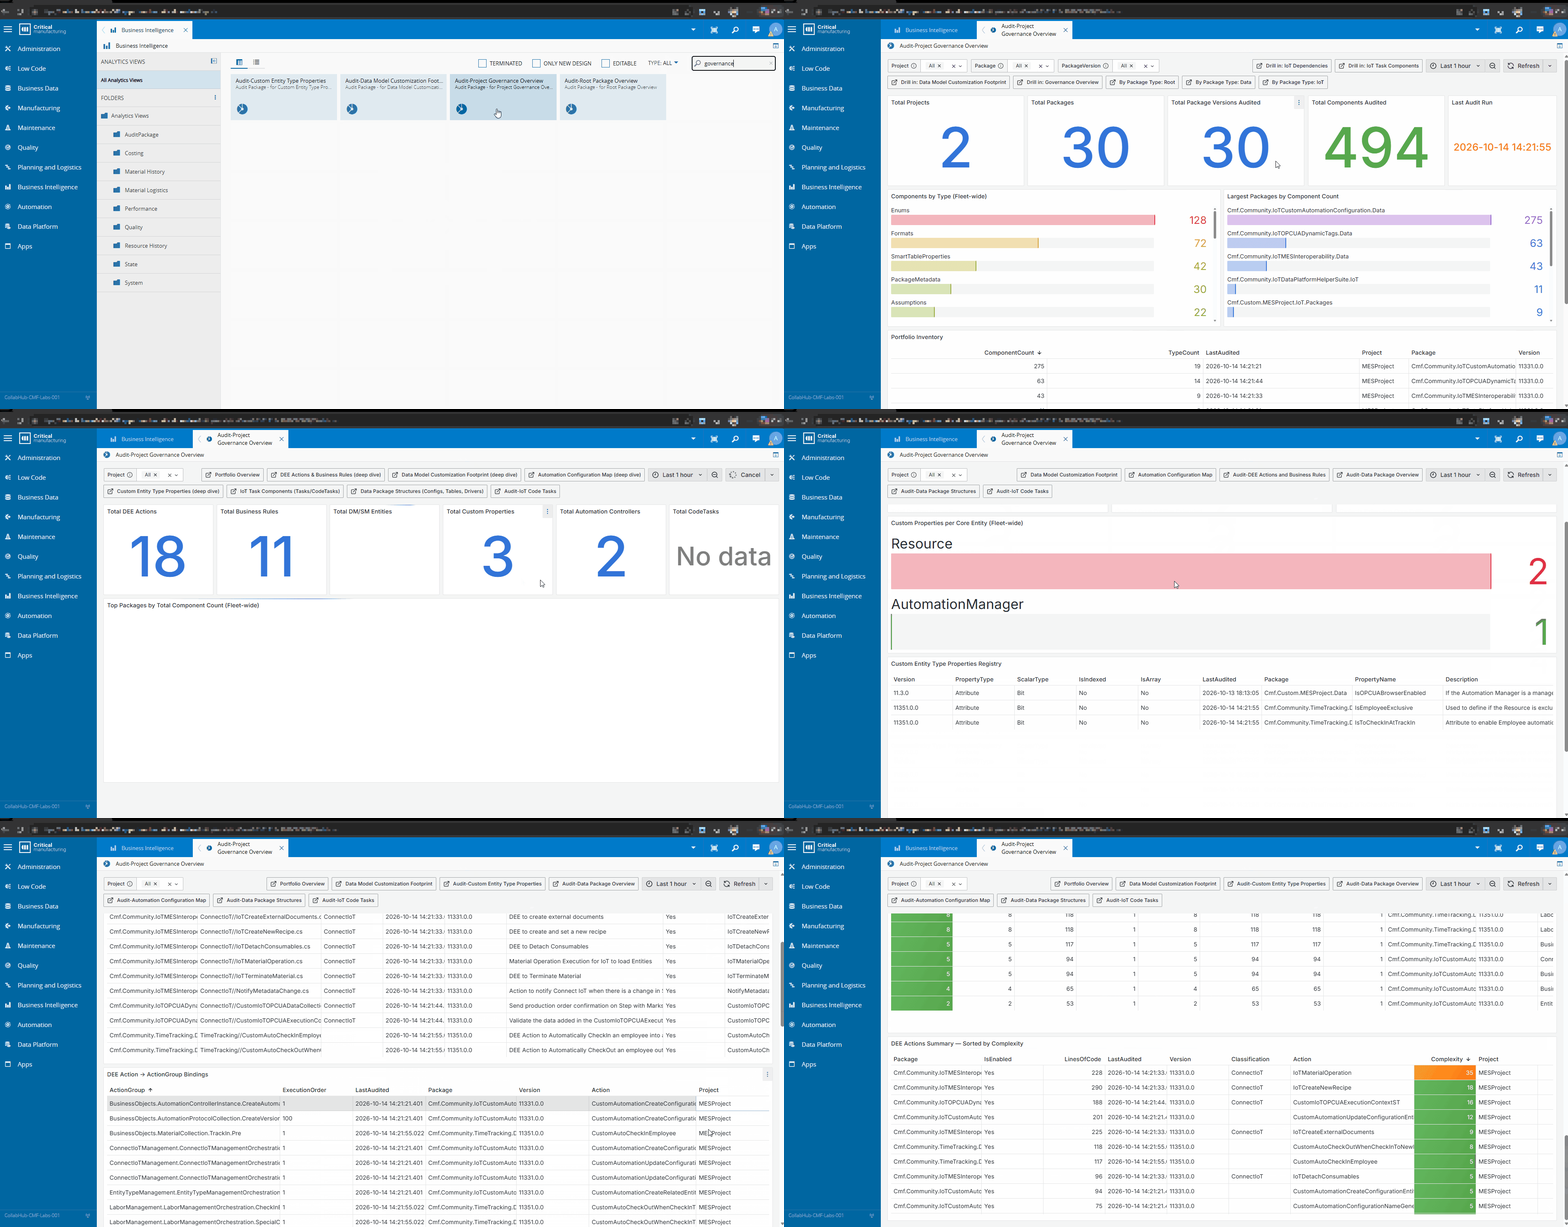
What to look at: the audit running against a project and the results landing in the generated dashboards.
What Is an MES Project, Really?#
A Critical Manufacturing MES project is not a running system. It is a repository: a root package that depends on a tree of versioned, typed packages, each delivered to a customer. The CM CLI gives that tree a uniform structure, so we know every package type and broadly what it is for.
A Data package carries configuration as metadata: MES modeling, low-code workflows, business rules, master data. Business and HTML packages carry customization code. IoT packages carry equipment integration tasks, converters and drivers.
As the product grows, more behavior moves from code into that metadata layer: UI low code, IoT low code, rules configured instead of programmed. The customization does not disappear. It changes shape, and the share of a project that is code versus configuration is exactly what nobody measures.
That is the question the audit answers, and the only honest answer is a set of numbers per project.
What It Measures#
The audit runs one auditor per package type, plus one for the project root. Everything below comes straight from the plugin source.
| Package type | What cmf audit collects |
|---|---|
| Root | Project configuration from .project-config.json (MES version, registries, generator and schematics versions). Package id, version, first-level dependency count, test package count, global.json SDK and roll-forward, repositories, NuGet sources. Unused packages (a cmfpackage.json on disk that the root dependency tree never references). Committed scripts (.ps1, .cmd, .bat, .sh). |
| Data and IoTData | Files per content type (exported objects, process rules pre/post, entity types, DEE, master data, automation workflows). Exported objects by type and name. Process rule counts per execution. DEE files with lines of code and cyclomatic complexity. Master data record counts per entity, with the record content. Automation workflows: tasks with inputs and outputs, code tasks with lines of code, MES service calls and entities mentioned, converters. |
| IoT | Tasks, converters and drivers with injects, inputs, outputs or parameters, and lines of code. Whether each one is bundled with the package or lives in an Automation Task Library. package.json dependencies. Totals for customization objects, tasks and converters. |
| Pipeline | The committed Builds folder hashed against what the CM pipeline tool would generate today. Files only in the repo, only in the generated output, or present in both with different content. Local report only: this auditor does not post to the MES. |
Two things the table hides. The auditor also records unaudited dependencies, packages the root references that are not in the working copy, so a gap in coverage is visible rather than silent.
How the Dashboards Use It#
The Cmf.Audit package deploys Grafana dashboards on top of the telemetry. They are organized around the questions above: a project portfolio overview, a project governance view, a root package overview, data package overview and structures, the data model customization footprint, custom entity type properties, DEE actions and business rules, automation configuration maps, and for IoT the package overview, code tasks, converters, task components and dependencies.
You can look at one project and see how many DEEs it carries and how complex they are, or how many IoT tasks are bundled versus shared.
Counts are weak proxies for complexity and quality. A project with 400 trivial entity types is easier to carry than one with ten 2,000-line DEEs, and the moment a count becomes a target people will game it. We use the numbers to start conversations and to see trends, never to score a team.
What We Found#
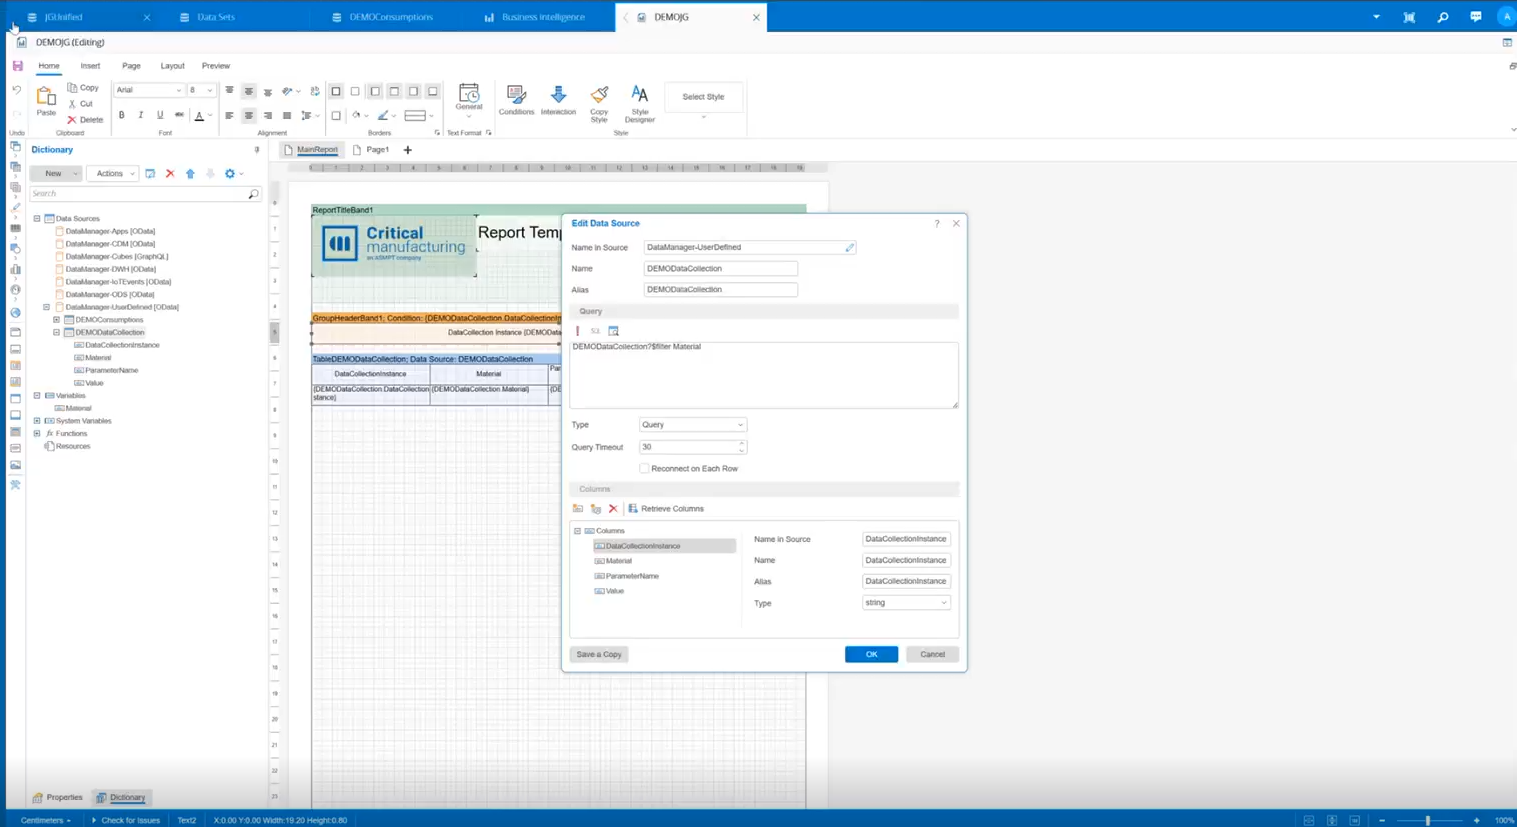
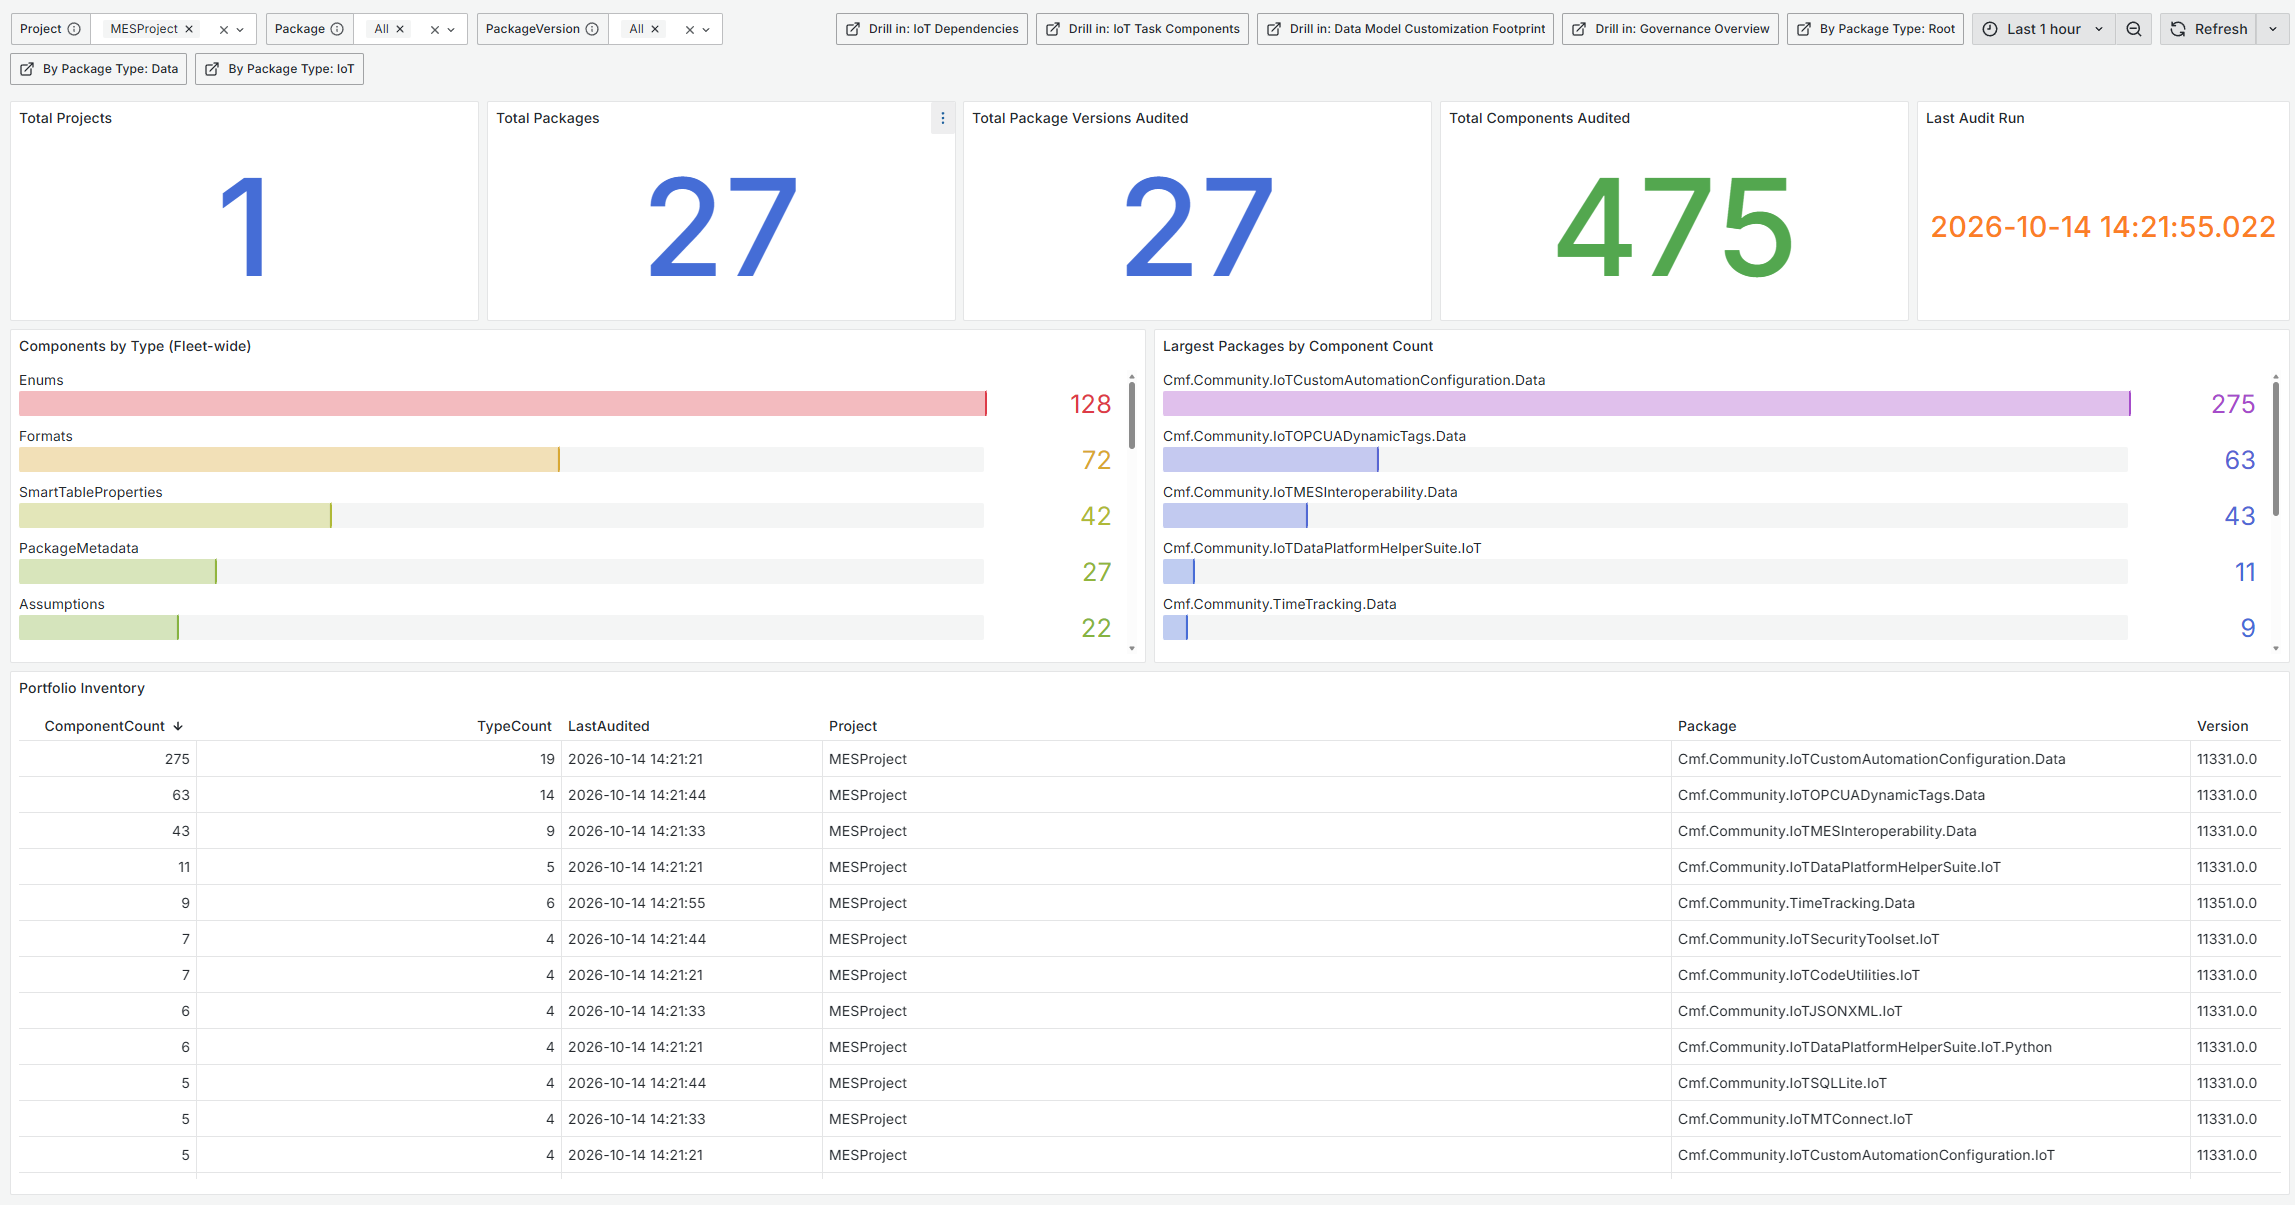
By Project filtering, we can see the data governance. What are its packages, when was the last time it was audited, what are the versions it’s currently deploying and have a notion of scale.
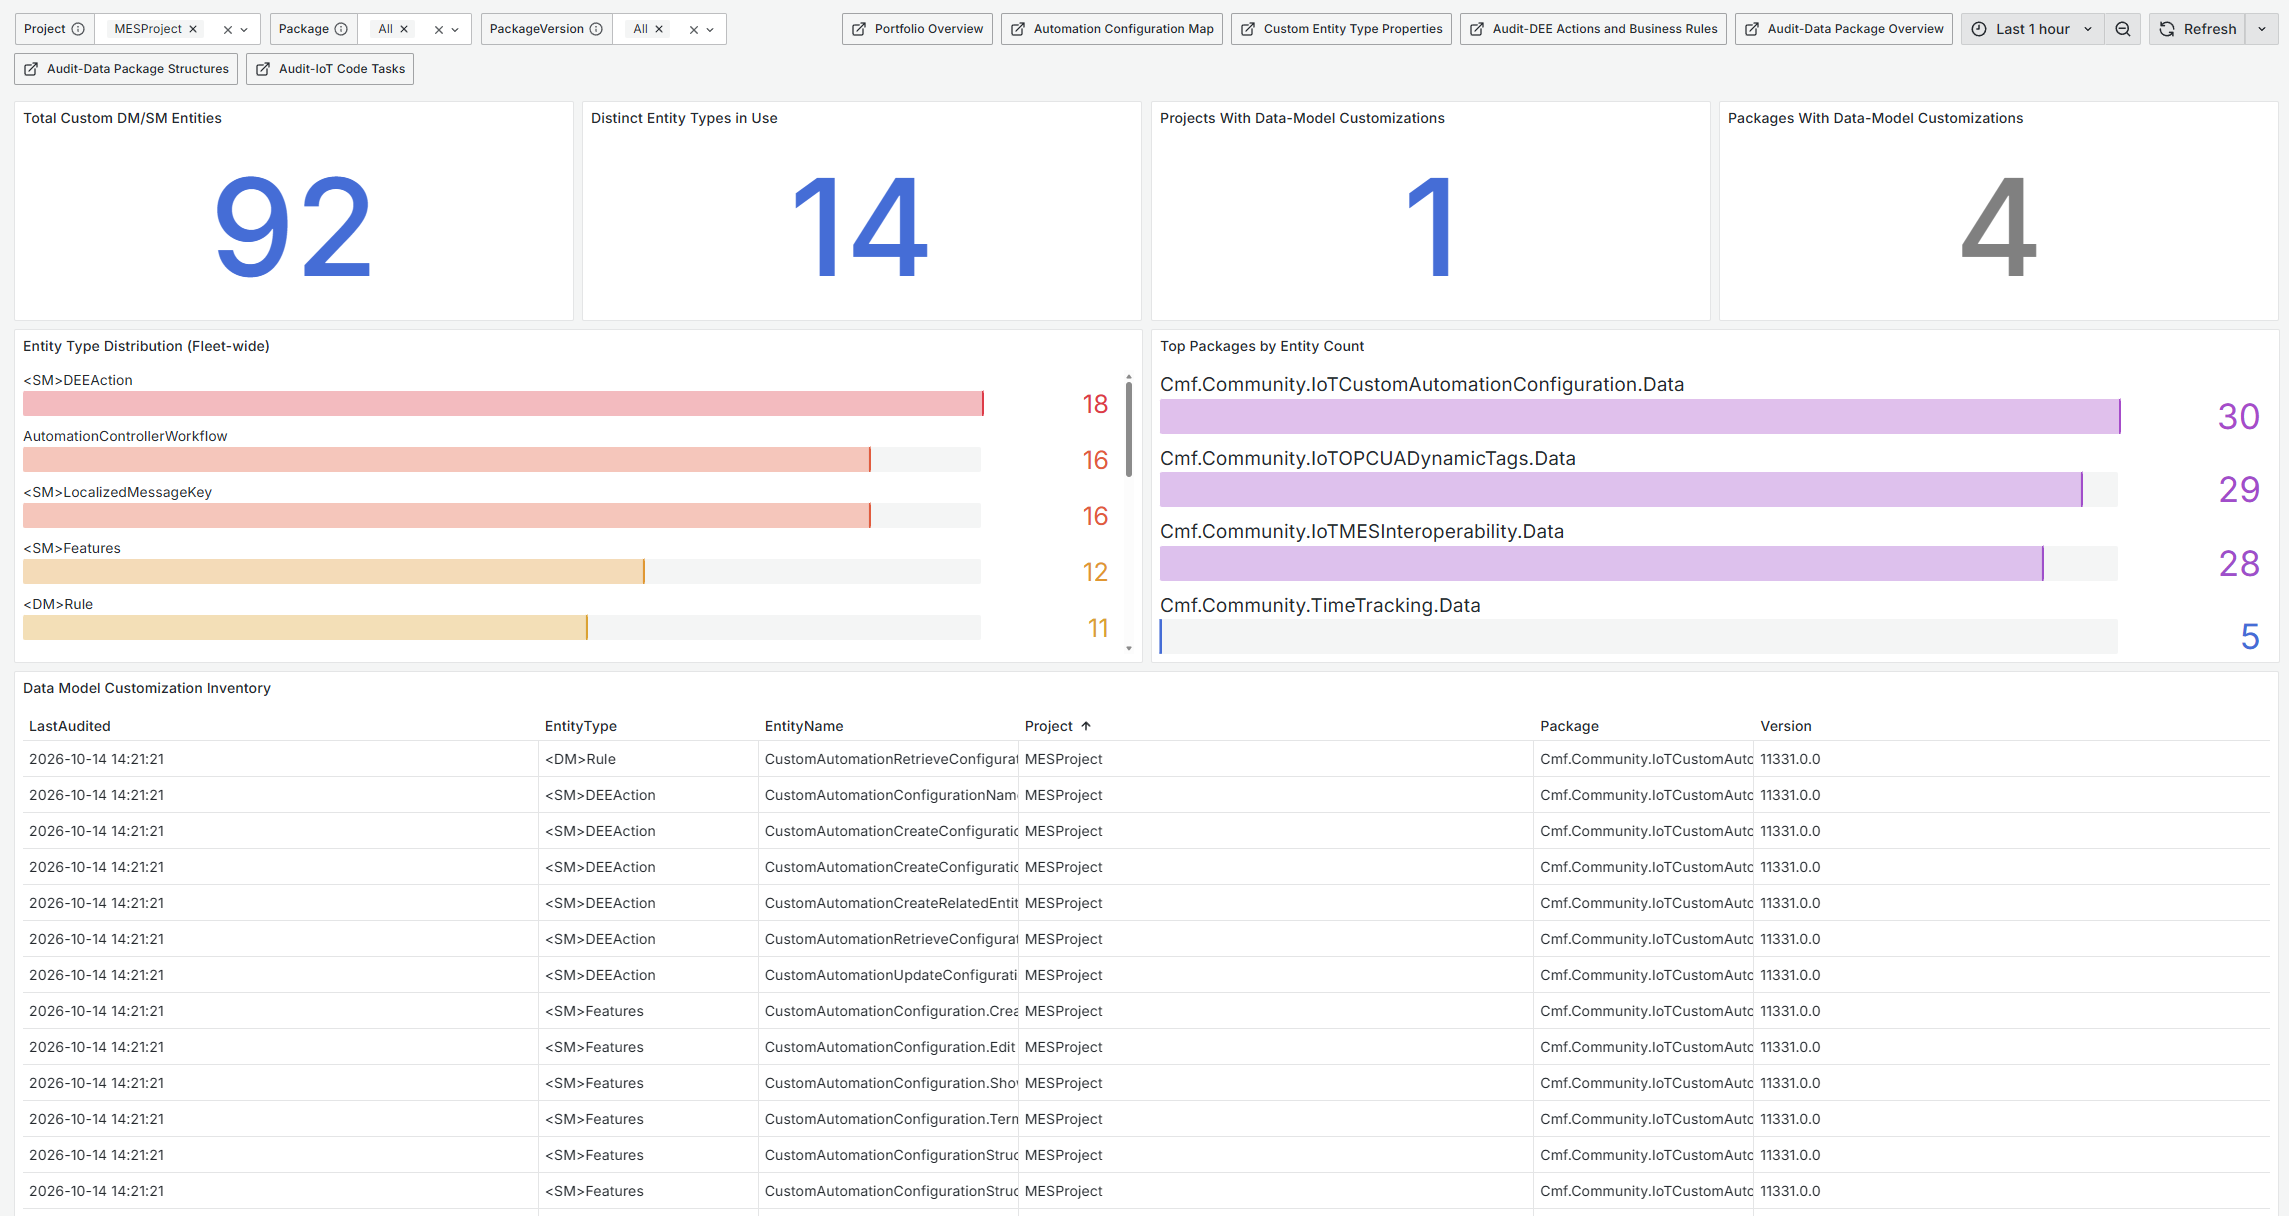
We can dig deeper and understand where our business complexity lies, if it’s on configurations or business rules, with dedicated screens.
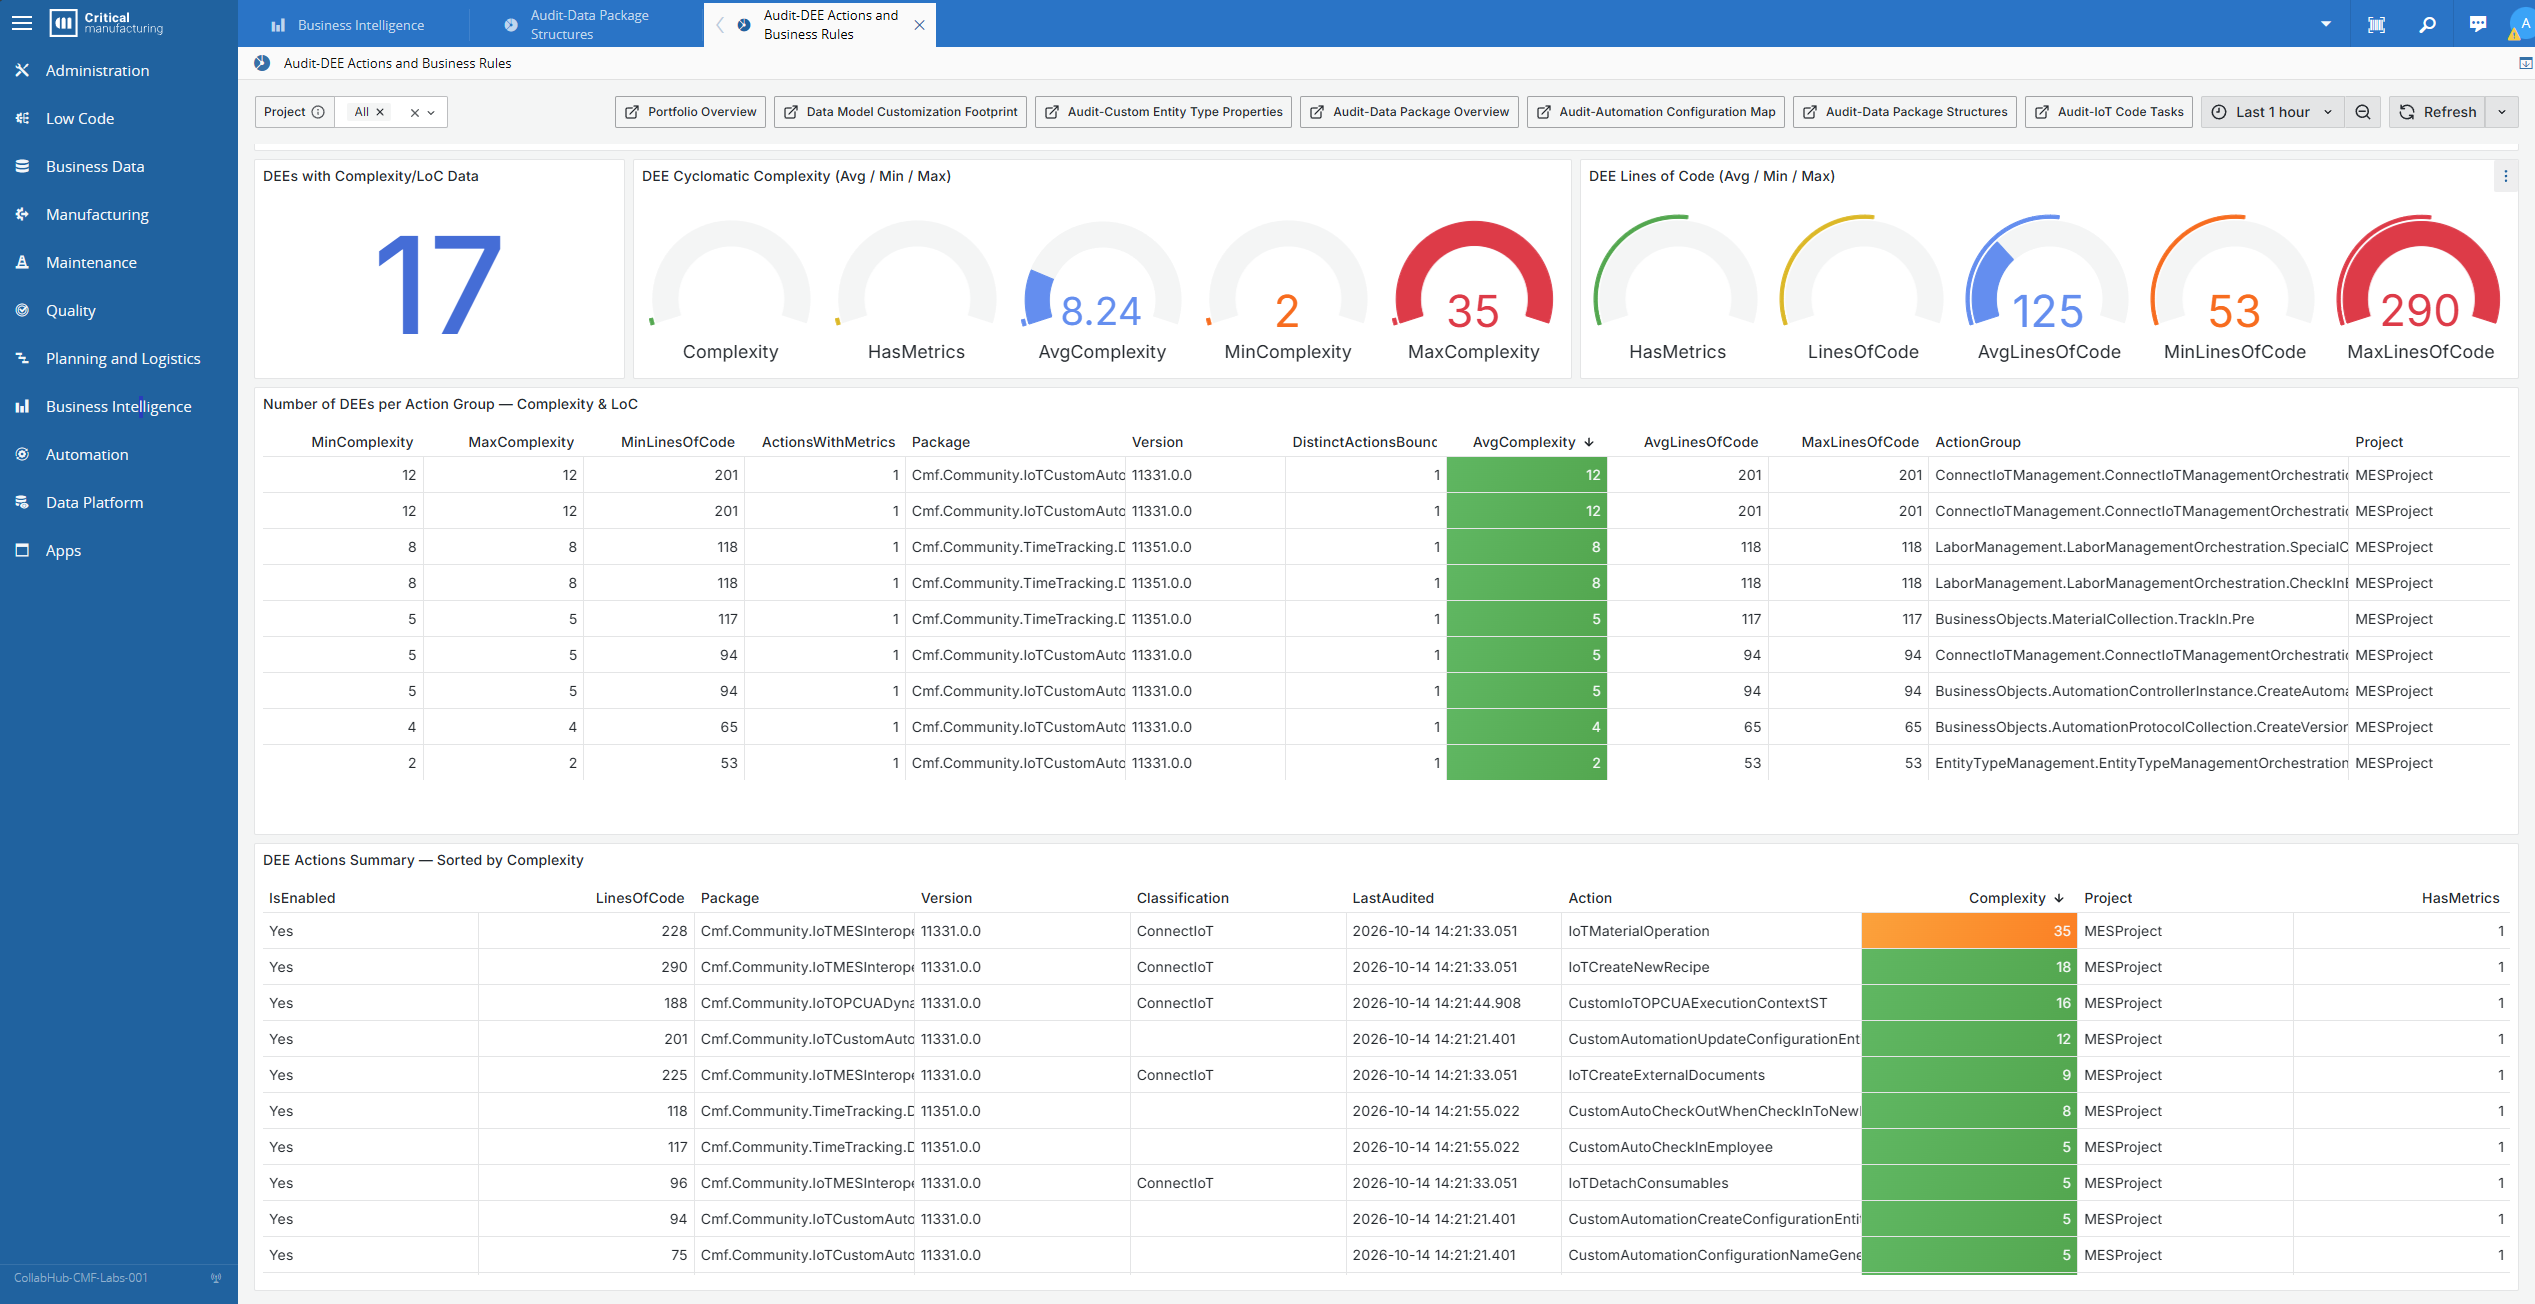
We can dig deeper and understand where we are hooking our custom business rules and how complex they are. This is a good metric to understand if you will have performance issues or if you are customizing out of your comfort zone.
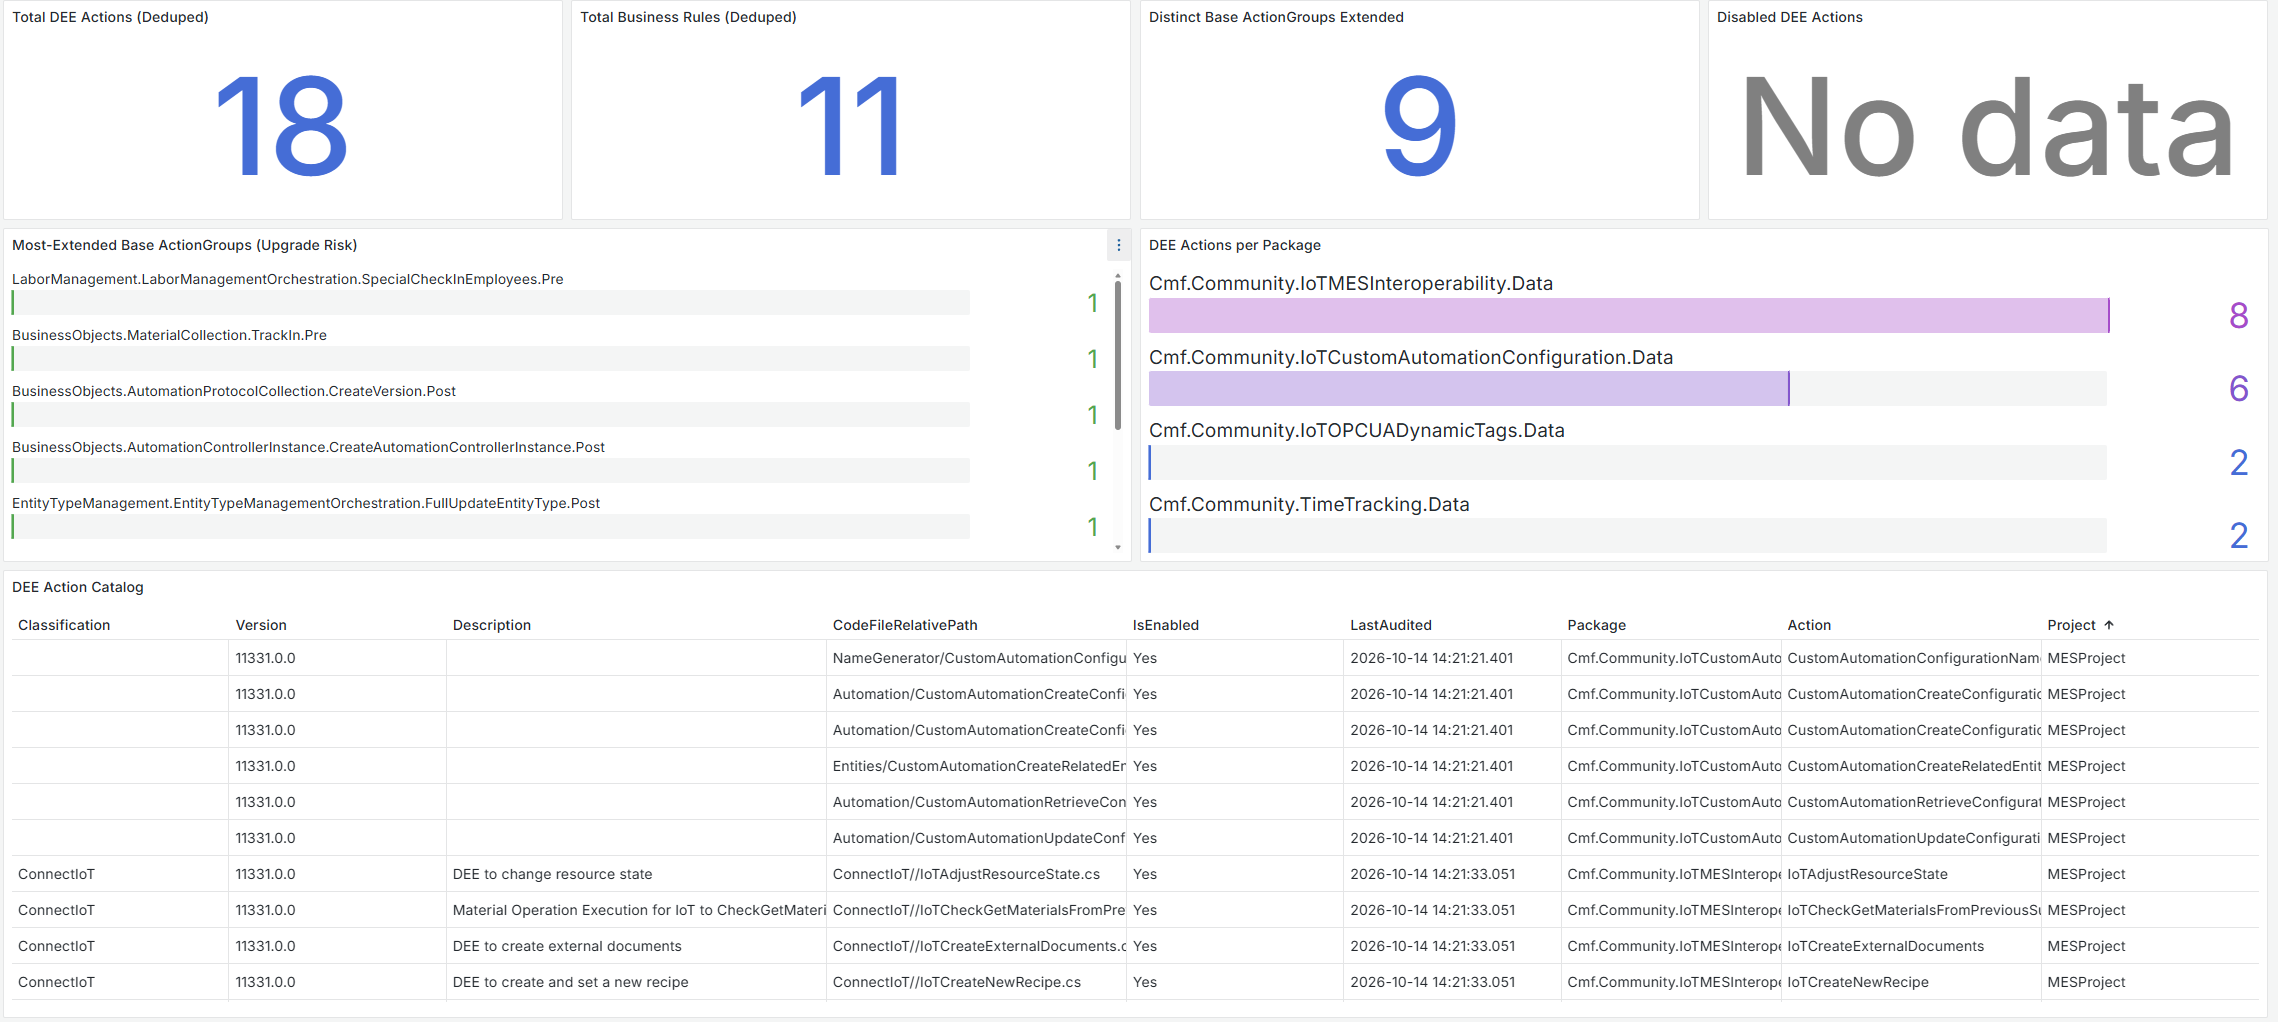
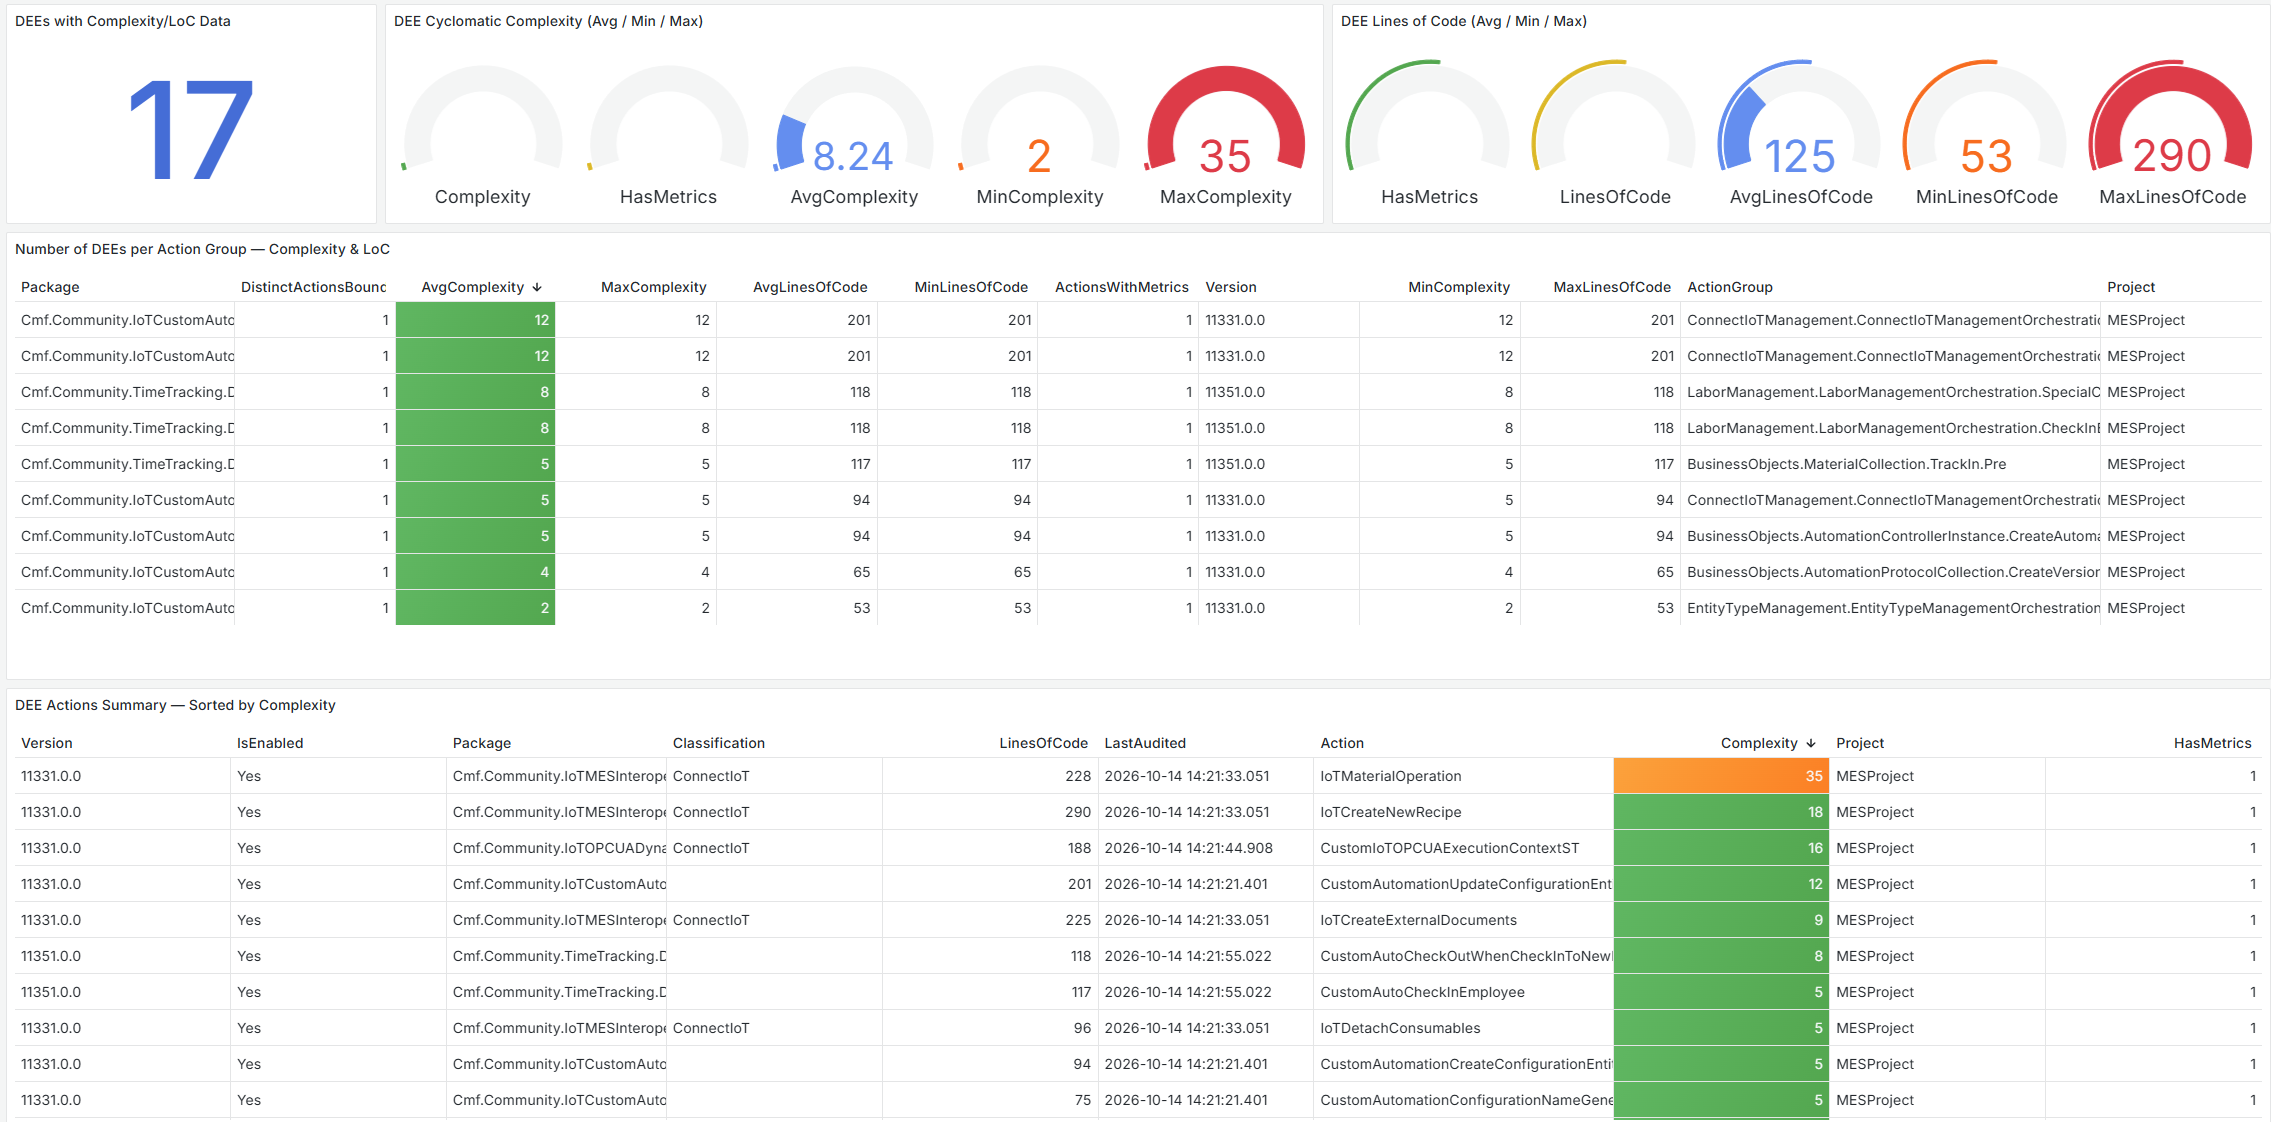
This is just a small sample of the types of drill downs and rabbit holes we can go to understand our project. Of course we are looking at snapshots, but over time if you audit every release, you are able to see how your solution is evolving.
So what is an MES project? After the run above, the answer fits in one table: this many packages, of these types, carrying this much configuration and this much code.
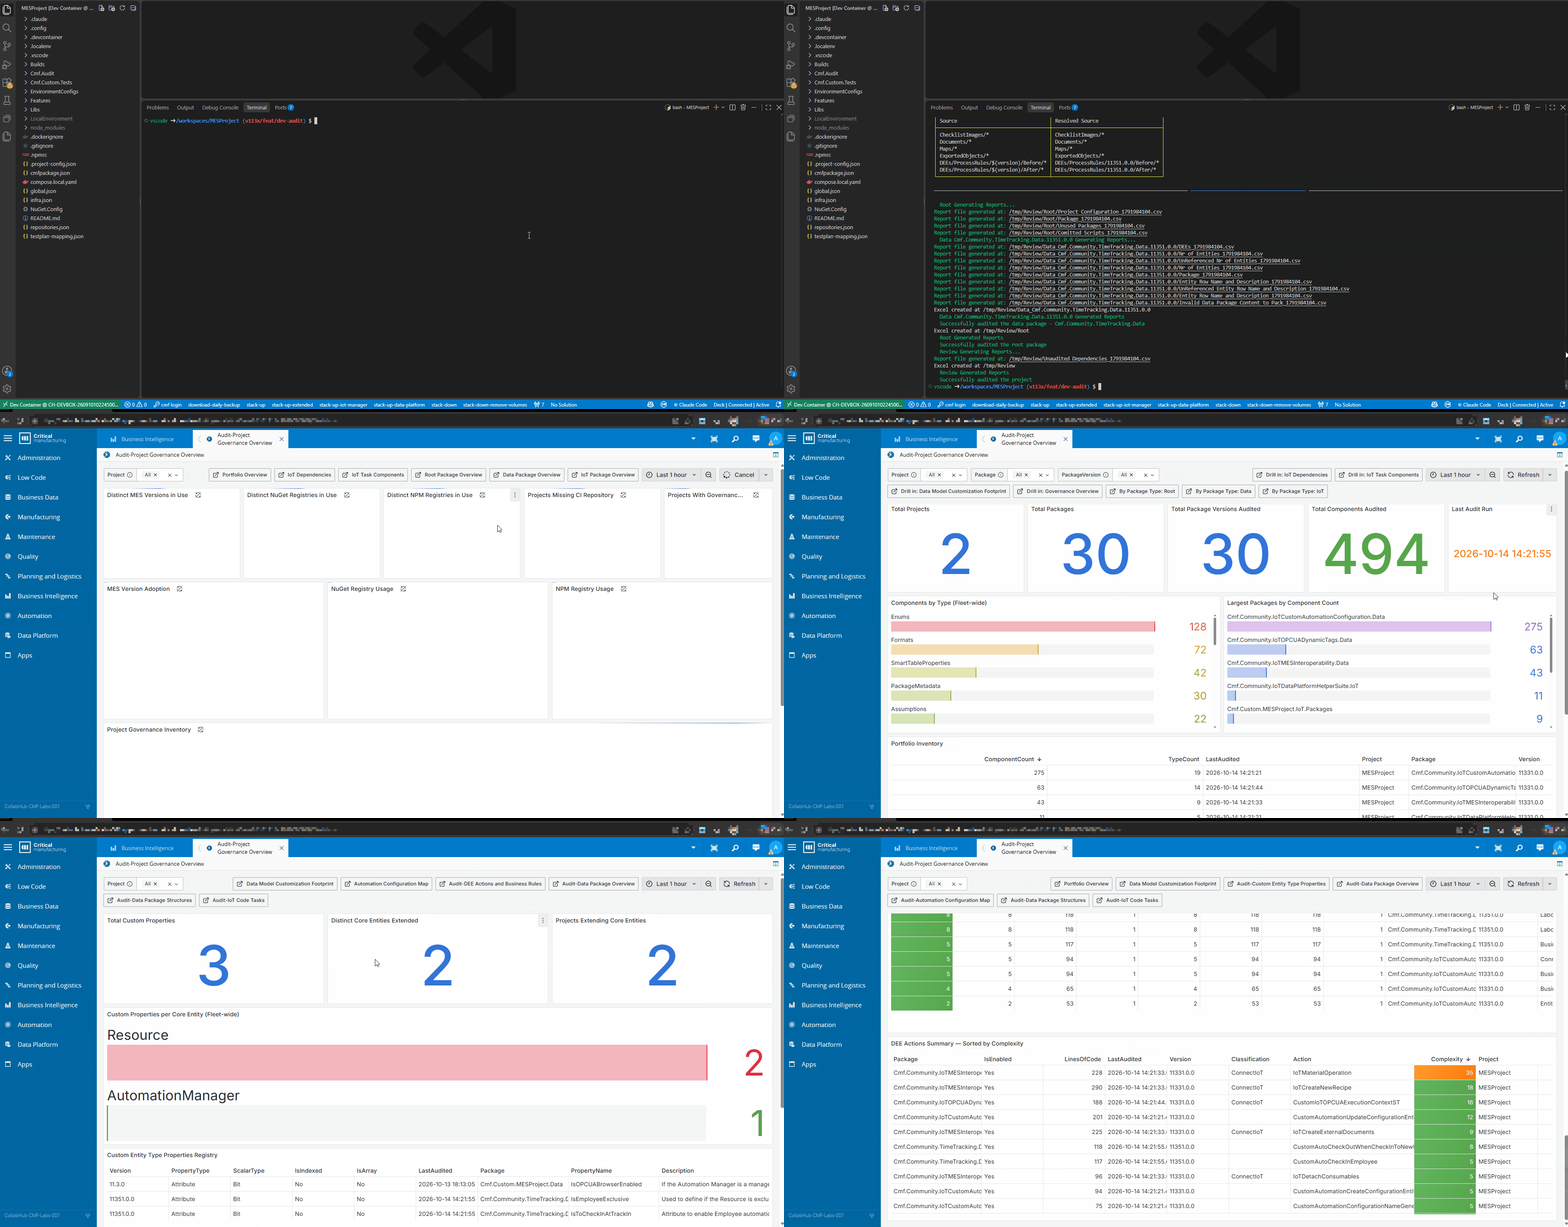
What to look at: one command walking every project in the repository and posting each one’s audit to the local MES, with the projects appearing side by side in the dashboards.
Why Telemetry, and Why the MES#
Auditing a project produces a snapshot: a set of measurements, at a point in time, about a thing with a hierarchical identity. That is the shape of telemetry. A telemetry store already knows how to keep timestamped values keyed by a hierarchy, aggregate them, and show them over time. Re-running the audit nightly or every release gives you a trend line for free.
The first idea was to post to our global telemetry database. We dropped it for two reasons. It would force an outside-the-project dependency, and it would kill local runs. So we went with the MES we already ship.
Every CM MES comes with the MES Data Platform, the event-driven layer that ingests events, materializes them into a columnar database, and exposes them through datasets and Grafana dashboards (Data Platform user guide). That gives us ingestion, aggregation, dashboards and deployment without writing a backend. The dashboards and datasets are themselves a customization package, so they install with the same tooling as everything else, and teams can build their own with skills they already have.
We used the same engine built for massive manufacturing data volume, to store our audit system.
The audit is not a check of a running MES. It reads a repository, and the MES plays only one role: the data sink. That is also why a running MES and an access token are required to post results.
There is a fair objection here. If the pitch is “run it locally, no outside dependencies”, needing a token and a reachable MES looks like a contradiction. It is a narrower promise than that. The audit itself runs locally and writes console output, CSV and Excel with no MES at all. Posting is opt-in (--postEvent) and needs the MES host, a tenant and a security token, which belongs in CMF_AUDIT_SECURITY_TOKEN rather than on the command line. The token is the price of the dashboards, and the audit posts master data record content for Data packages, so only send it to systems you are allowed to send it to.
The MES is the sink, not the subject. Wiring it up costs one token. In return, the history lives where the customer’s own dashboard skills already are.
How a Project Becomes an ISA95 Path#
ISA95 is the standard that models a manufacturing enterprise as a hierarchy, from enterprise down to site, area and equipment. The CDM, CM’s Common Data Model, follows that structure to identify where an event came from.
The plugin borrows it, and the source comment says so plainly: “we will hijack the ISA95 for our context”. Every audit event is a PostTelemetry with this mapping:
| Audit concept | ISA95 level |
|---|---|
| Team project | Enterprise |
| Package id | Site |
| Package version | Facility |
Record type (Task, DEE, PackageMetadata…) | Area |
| Record name | Resource |
Each measured value becomes a parameter on that resource: numbers are stored as numeric values, everything else as strings. A project, a package and a version get a unique, queryable identity without a single new entity in the data model.
The ingestion uses the CDM Post Telemetry event, which is documented from MES 11.3. The audit package we ship targets 11.3, so treat 11.3 as the baseline. The plugin does not declare a minimum version in code.
What Multi-Site Looks Like#
A customer with several sites rarely has one project. It has a baseline and a handful of site projects that drift from it. With the telemetry above, each site’s project posts under its own Enterprise node, and the baseline posts under another. Putting them on one dashboard answers the questions a program manager actually asks: which site carries the most customization the baseline does not, which sites are behind on package versions, and which have unused packages nobody dares delete.
The architecture below is how we ran it against the whole mes-common-library.
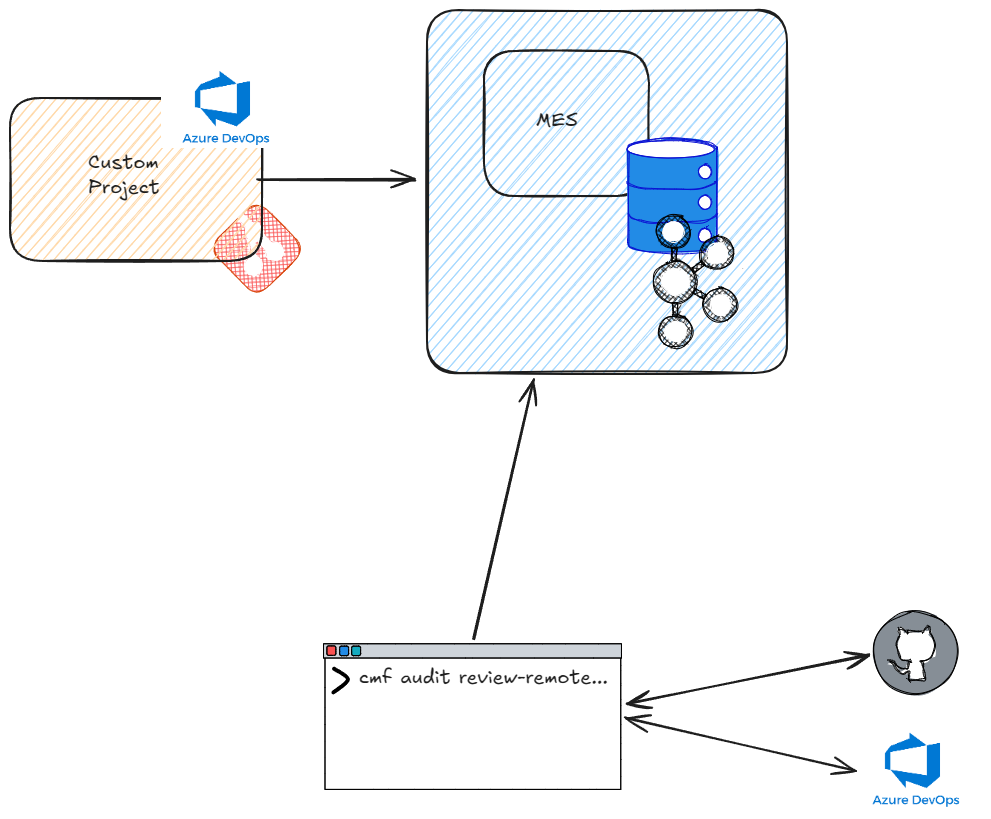
What to look at: the audit reads projects from the remote repository and posts every result to one MES, which is the only place the data lives.
Where This Fits#
Static-analysis tools such as SonarQube or CodeScene look at code quality and hotspots in any language. They do not know what a Data package, an exported object or an IoT task library is. cmf audit knows the CM package model and counts its units. It complements those tools and replaces none of them.
Trying It#
The tool lives in mes-common-library, with the README covering build and options. The current release is audit v0.0.1.
Copy it into your MES customization and deploy it to your local registry.
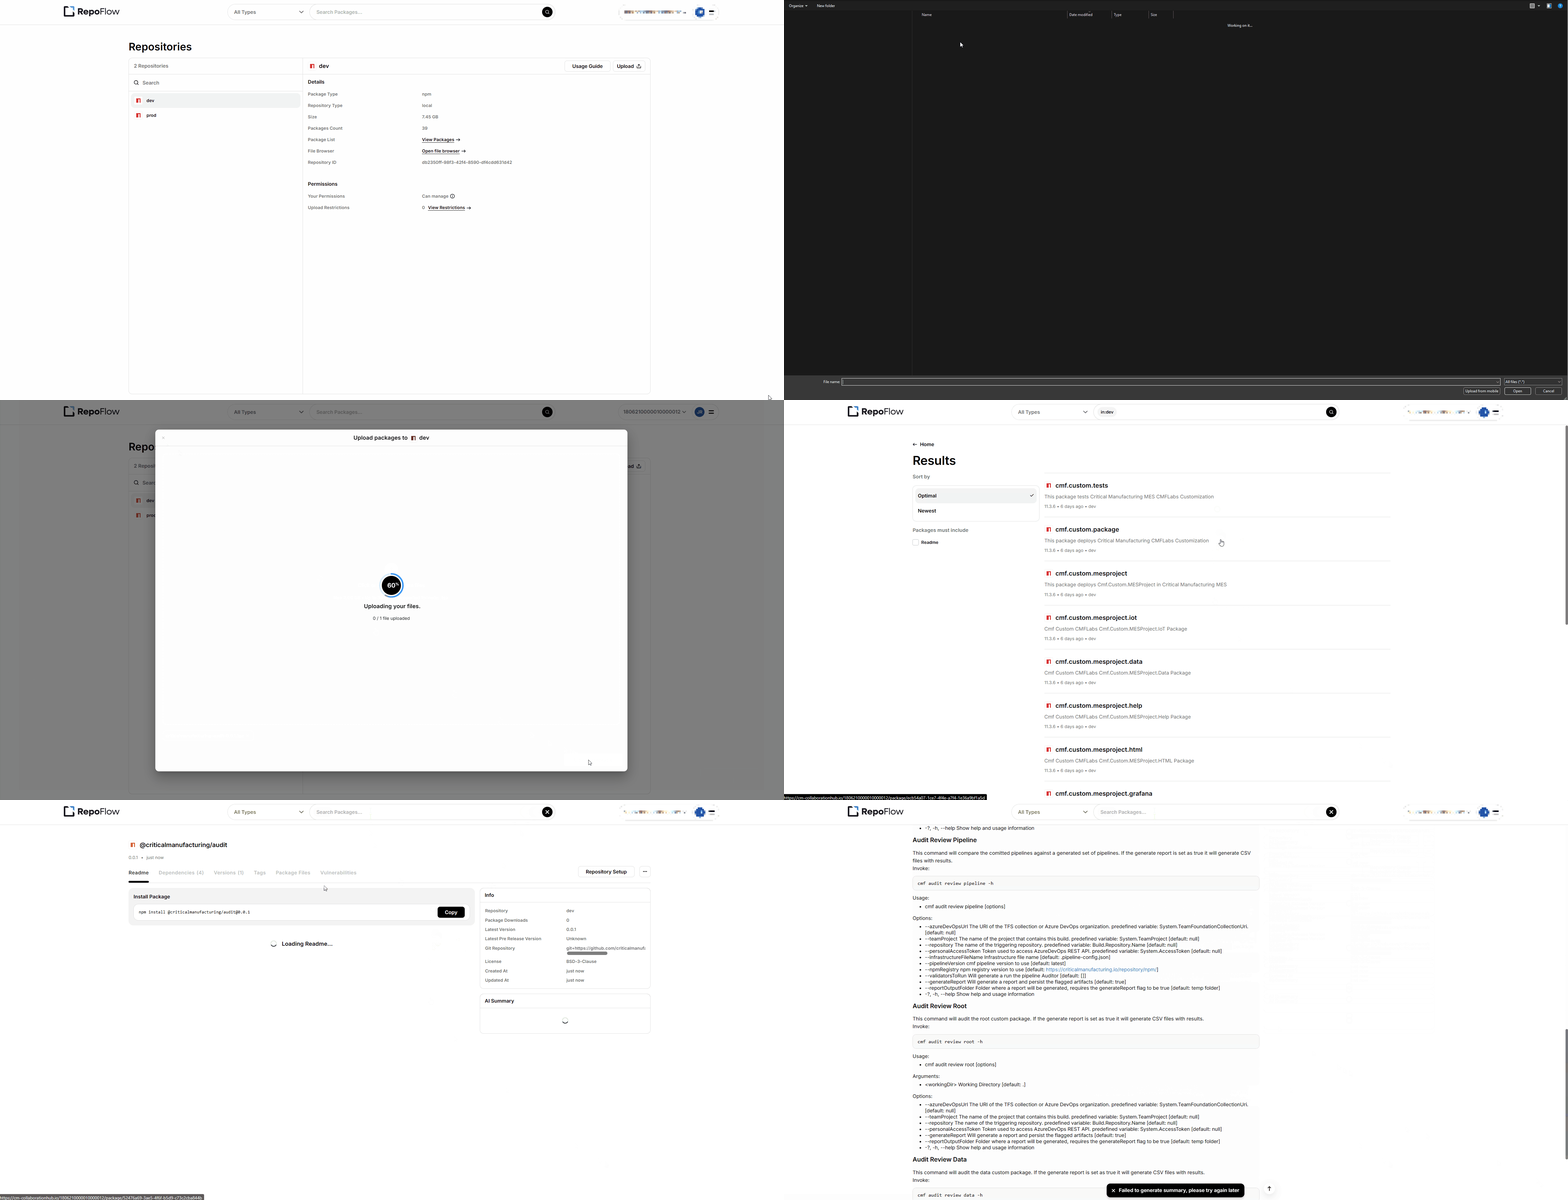
What to look at: the package landing in the project’s local registry.
Then install it globally. If your registry does not proxy npmjs, add a scope filter such as --@criticalmanufacturing:registry=https....
npm i -g @criticalmanufacturing/audit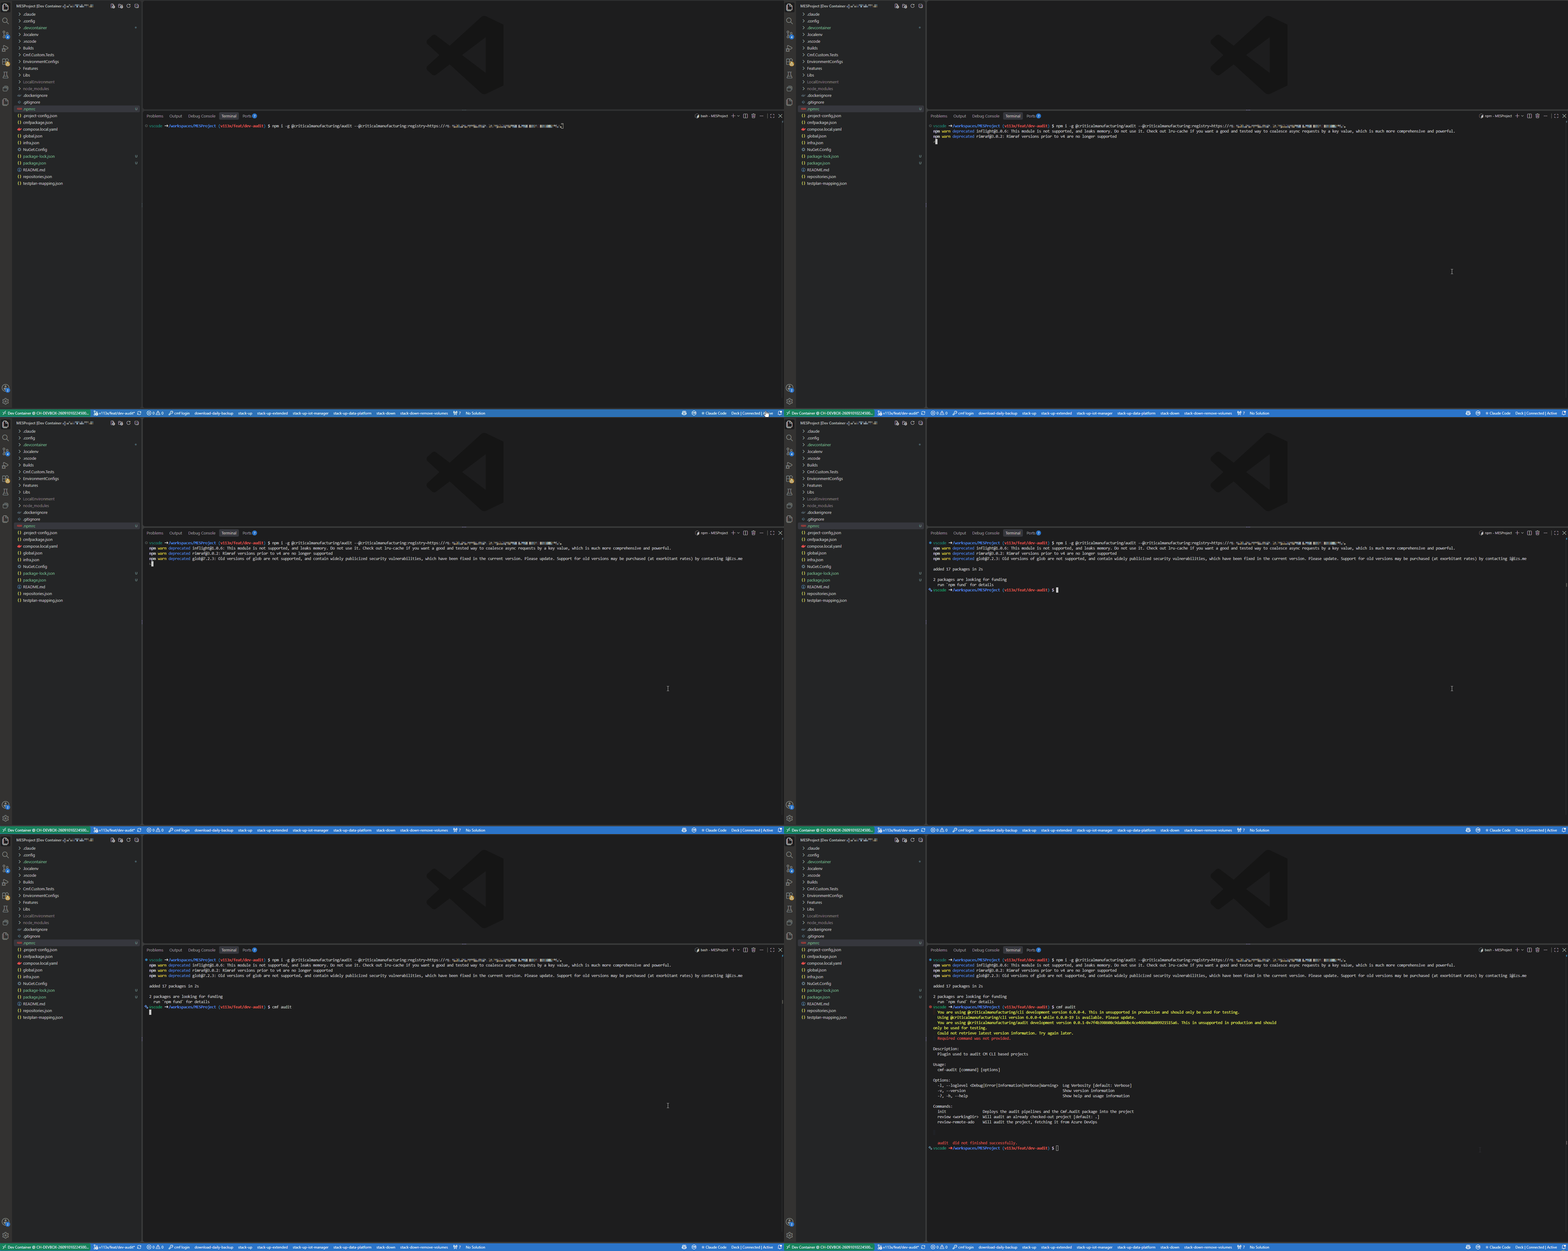
What to look at: the scoped install resolving from the private registry.
Run cmf audit init to scaffold the pipelines:
cmf audit initIt adds a CD-Audit pipeline and an audit step at the end of CD-Containers (the pipeline that builds and deploys the project into containers). It also adds the Cmf.Audit package with the dashboards and datasets, and a root dependency on it.
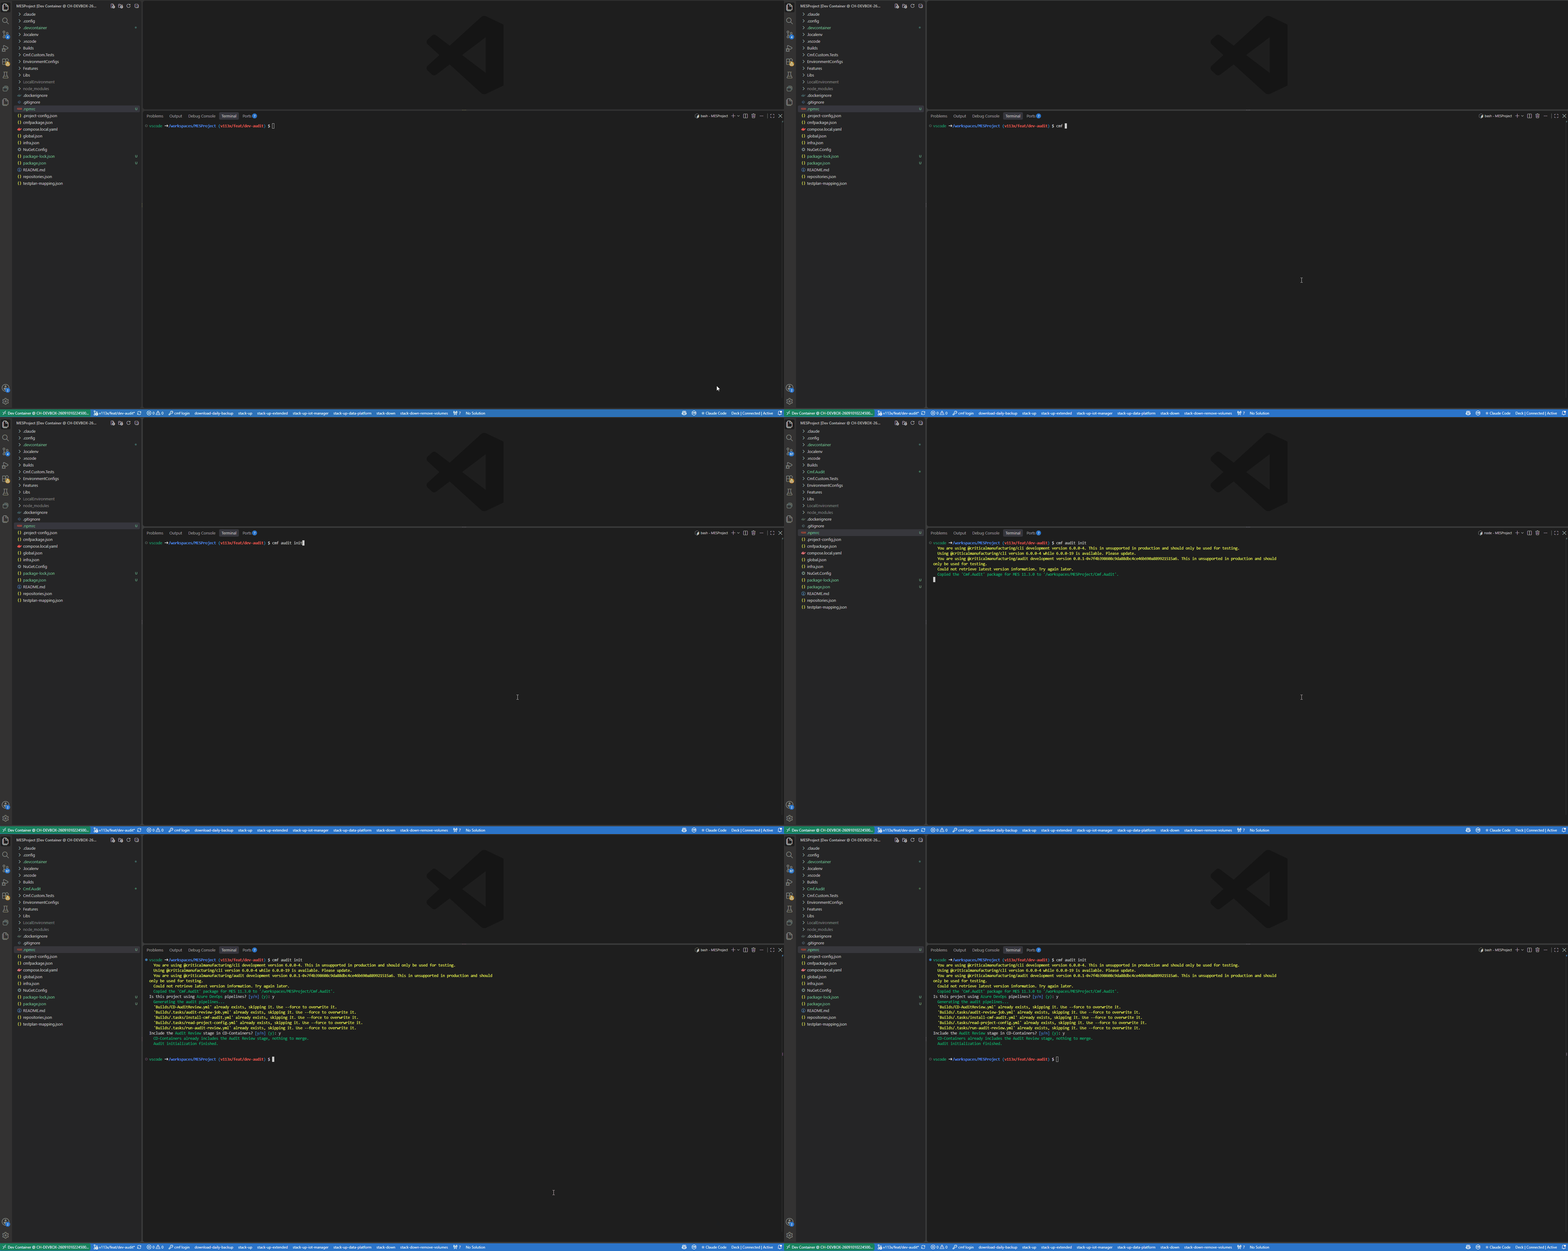
What to look at: the prompts and the files the init command adds to the project.
The audit step needs a system access token to post results. We typically generate it before creating the default MES backup, so the same token survives every restore.
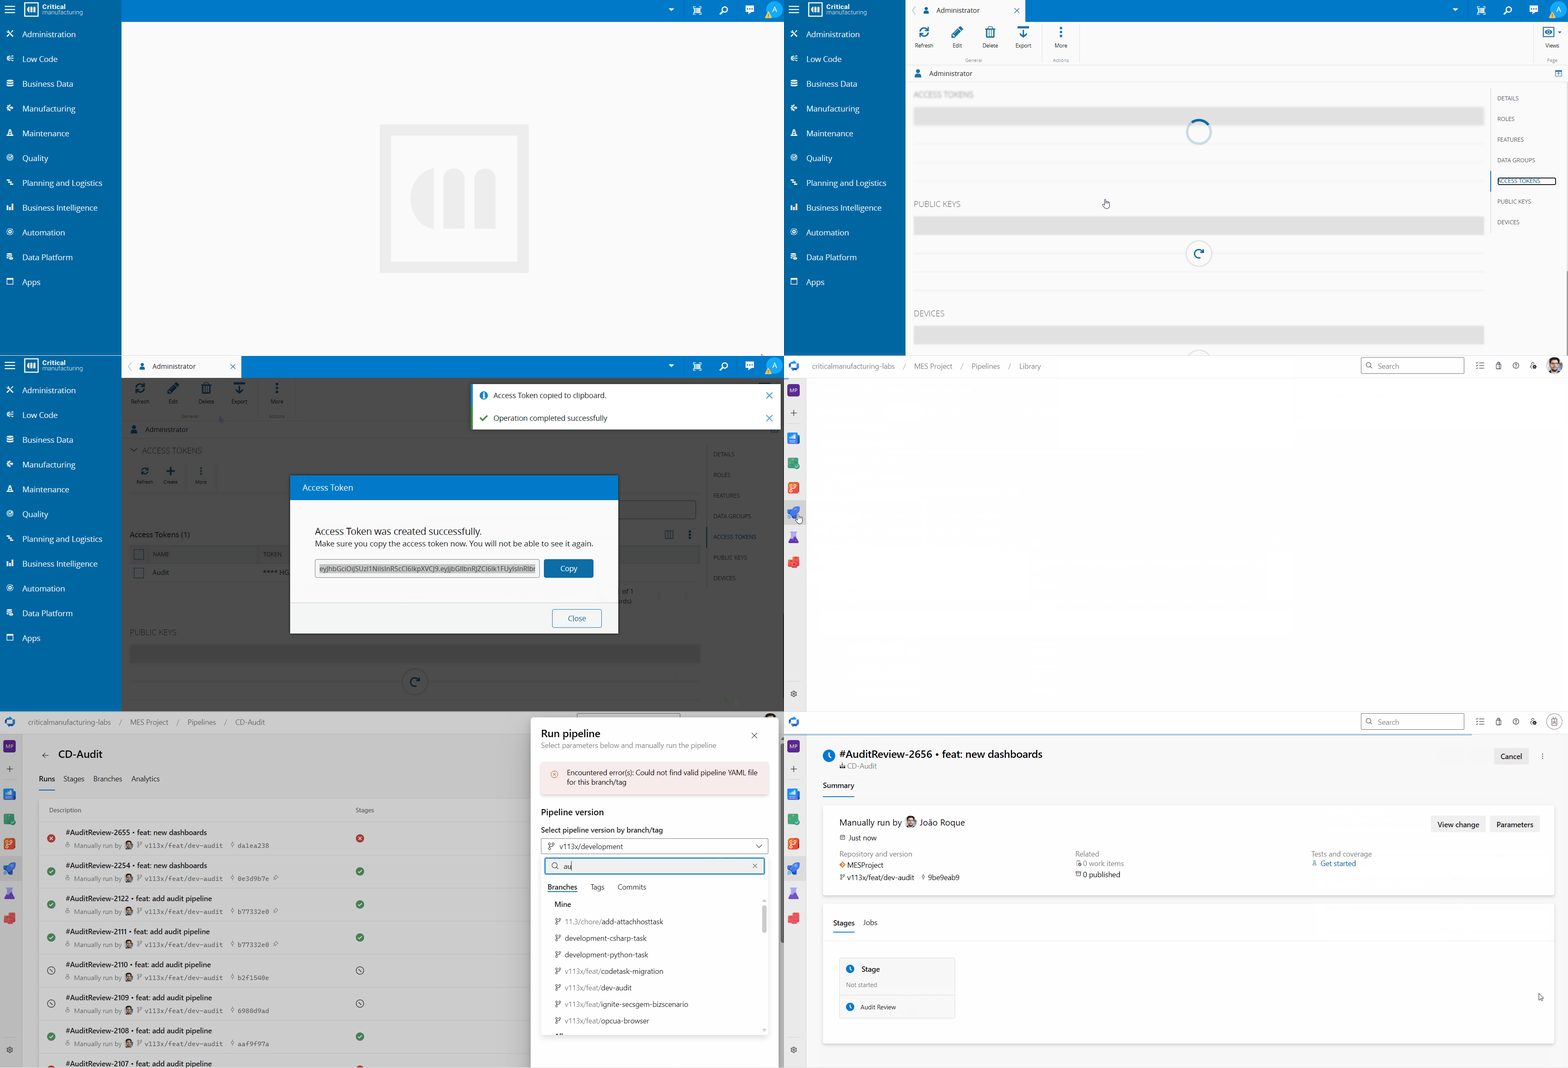
What to look at: creating the access token that the pipeline will use.
Then run CD-Audit directly, or let the final step in CD-Containers do it.
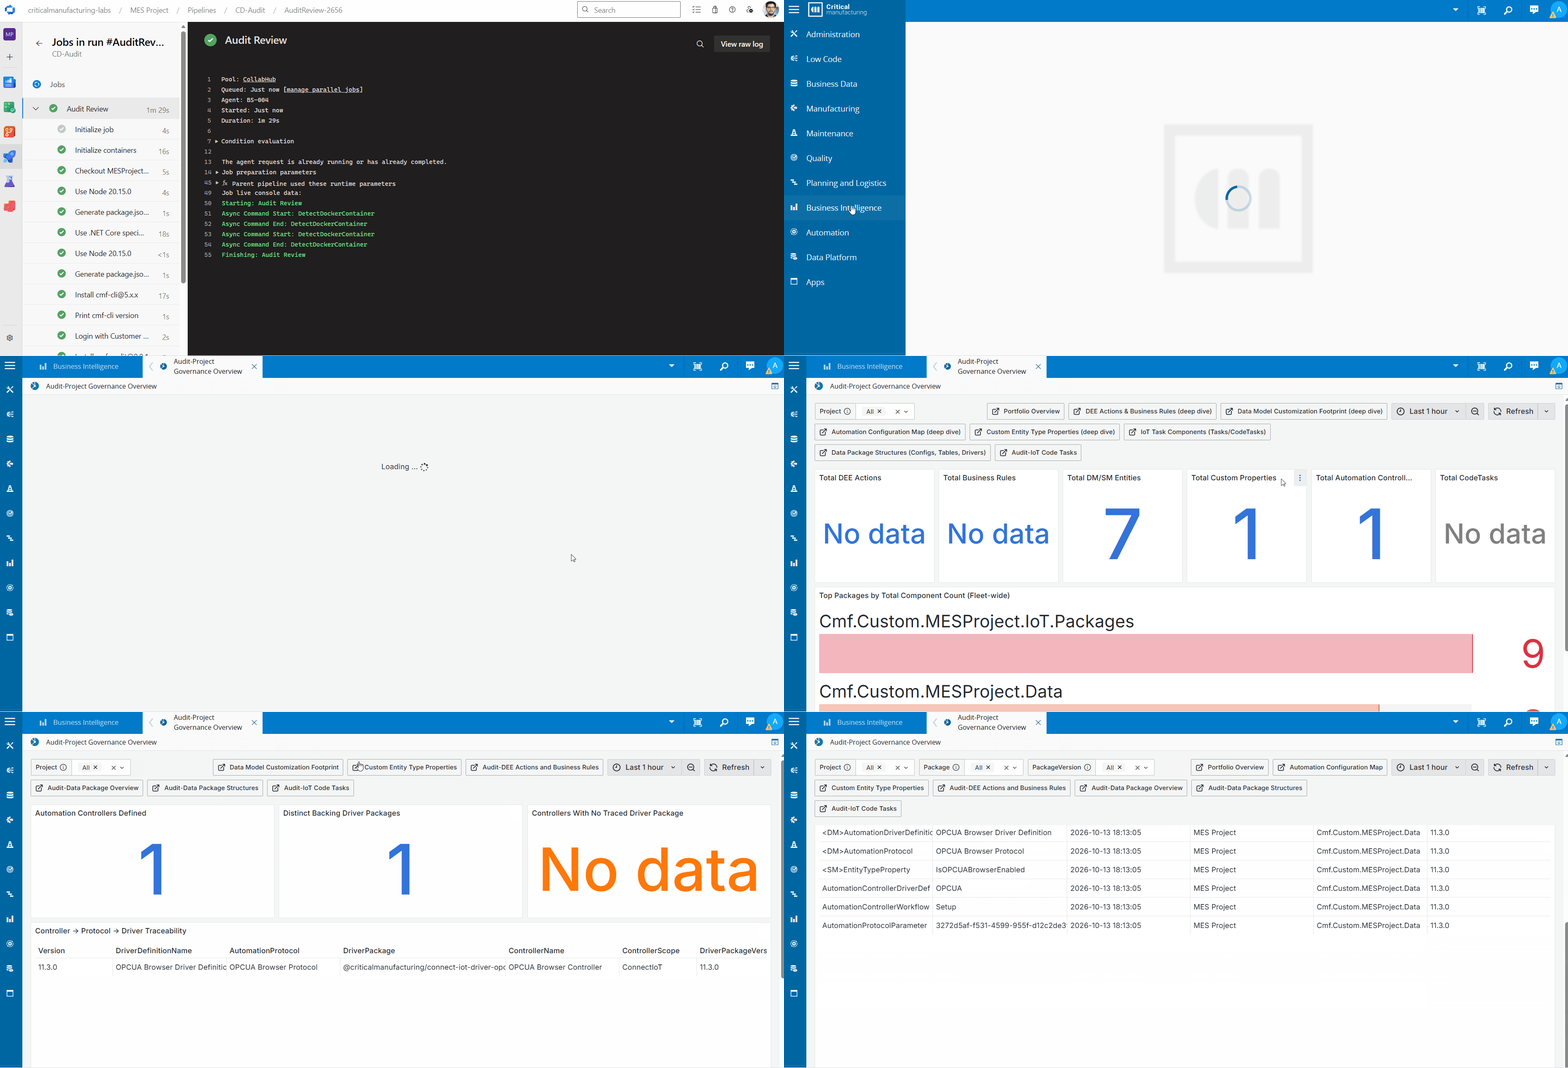
What to look at: the pipeline run, then the populated dashboards.
To audit projects without checking them out, use review-remote-github. It downloads a project folder from a GitHub repository at a given ref, audits it locally and posts the results. Use --repository, --gitRef, and --project or --path, and set GITHUB_TOKEN for private repositories. The default target is criticalmanufacturing/mes-common-library on 11.3/dev. The review-remote-ado command does the same for Azure DevOps.
A clarification on pipelines: cmf audit init only generates Azure DevOps YAML today. Running the audit against a GitHub-hosted repository works through the remote command, but you wire it into GitHub Actions yourself. The pipeline auditor also compares against Azure DevOps pipelines, so it needs Azure DevOps options even for a GitHub source.
What Comes Next#
The tool is at v0.0.1 and it shows. Business and HTML packages have no auditor, and the metric set is a first guess. We will roll it out to customer projects and let their feedback decide the rest.
Two uses are next on our list:
- Upgrade effort estimation. Pair the artifact counts (DEEs, code tasks, converters) with the target version’s breaking changes to price an upgrade before opening the repository.
- Multi-site comparison. Track every site against its baseline over time and see drift as it happens.
I have one specific question for you. Which artifact types should we audit next: Business packages, HTML and web customization, process rules, or something else you carry in your own projects? Tell us what you would measure, and what you would never want a dashboard to count.