Replacing a reporting stack is never really about reporting. It’s about admitting that the database keeping your factory running should never be the same database answering “how many units did we scrap last Tuesday.”
This is the first of a couple of posts on the new MES reporting architecture. This one covers the ground work, where the data comes from and how it gets to ClickHouse. The next one goes further into Stimulsoft itself.
The old way: three databases and a very literal pipeline#
The previous architecture is easy to describe because it’s exactly what it sounds like:
- an Online database for transactions
- an ODS (Operational Data Store) that mirrors it for querying
- a DWH (Data Warehouse) for aggregates
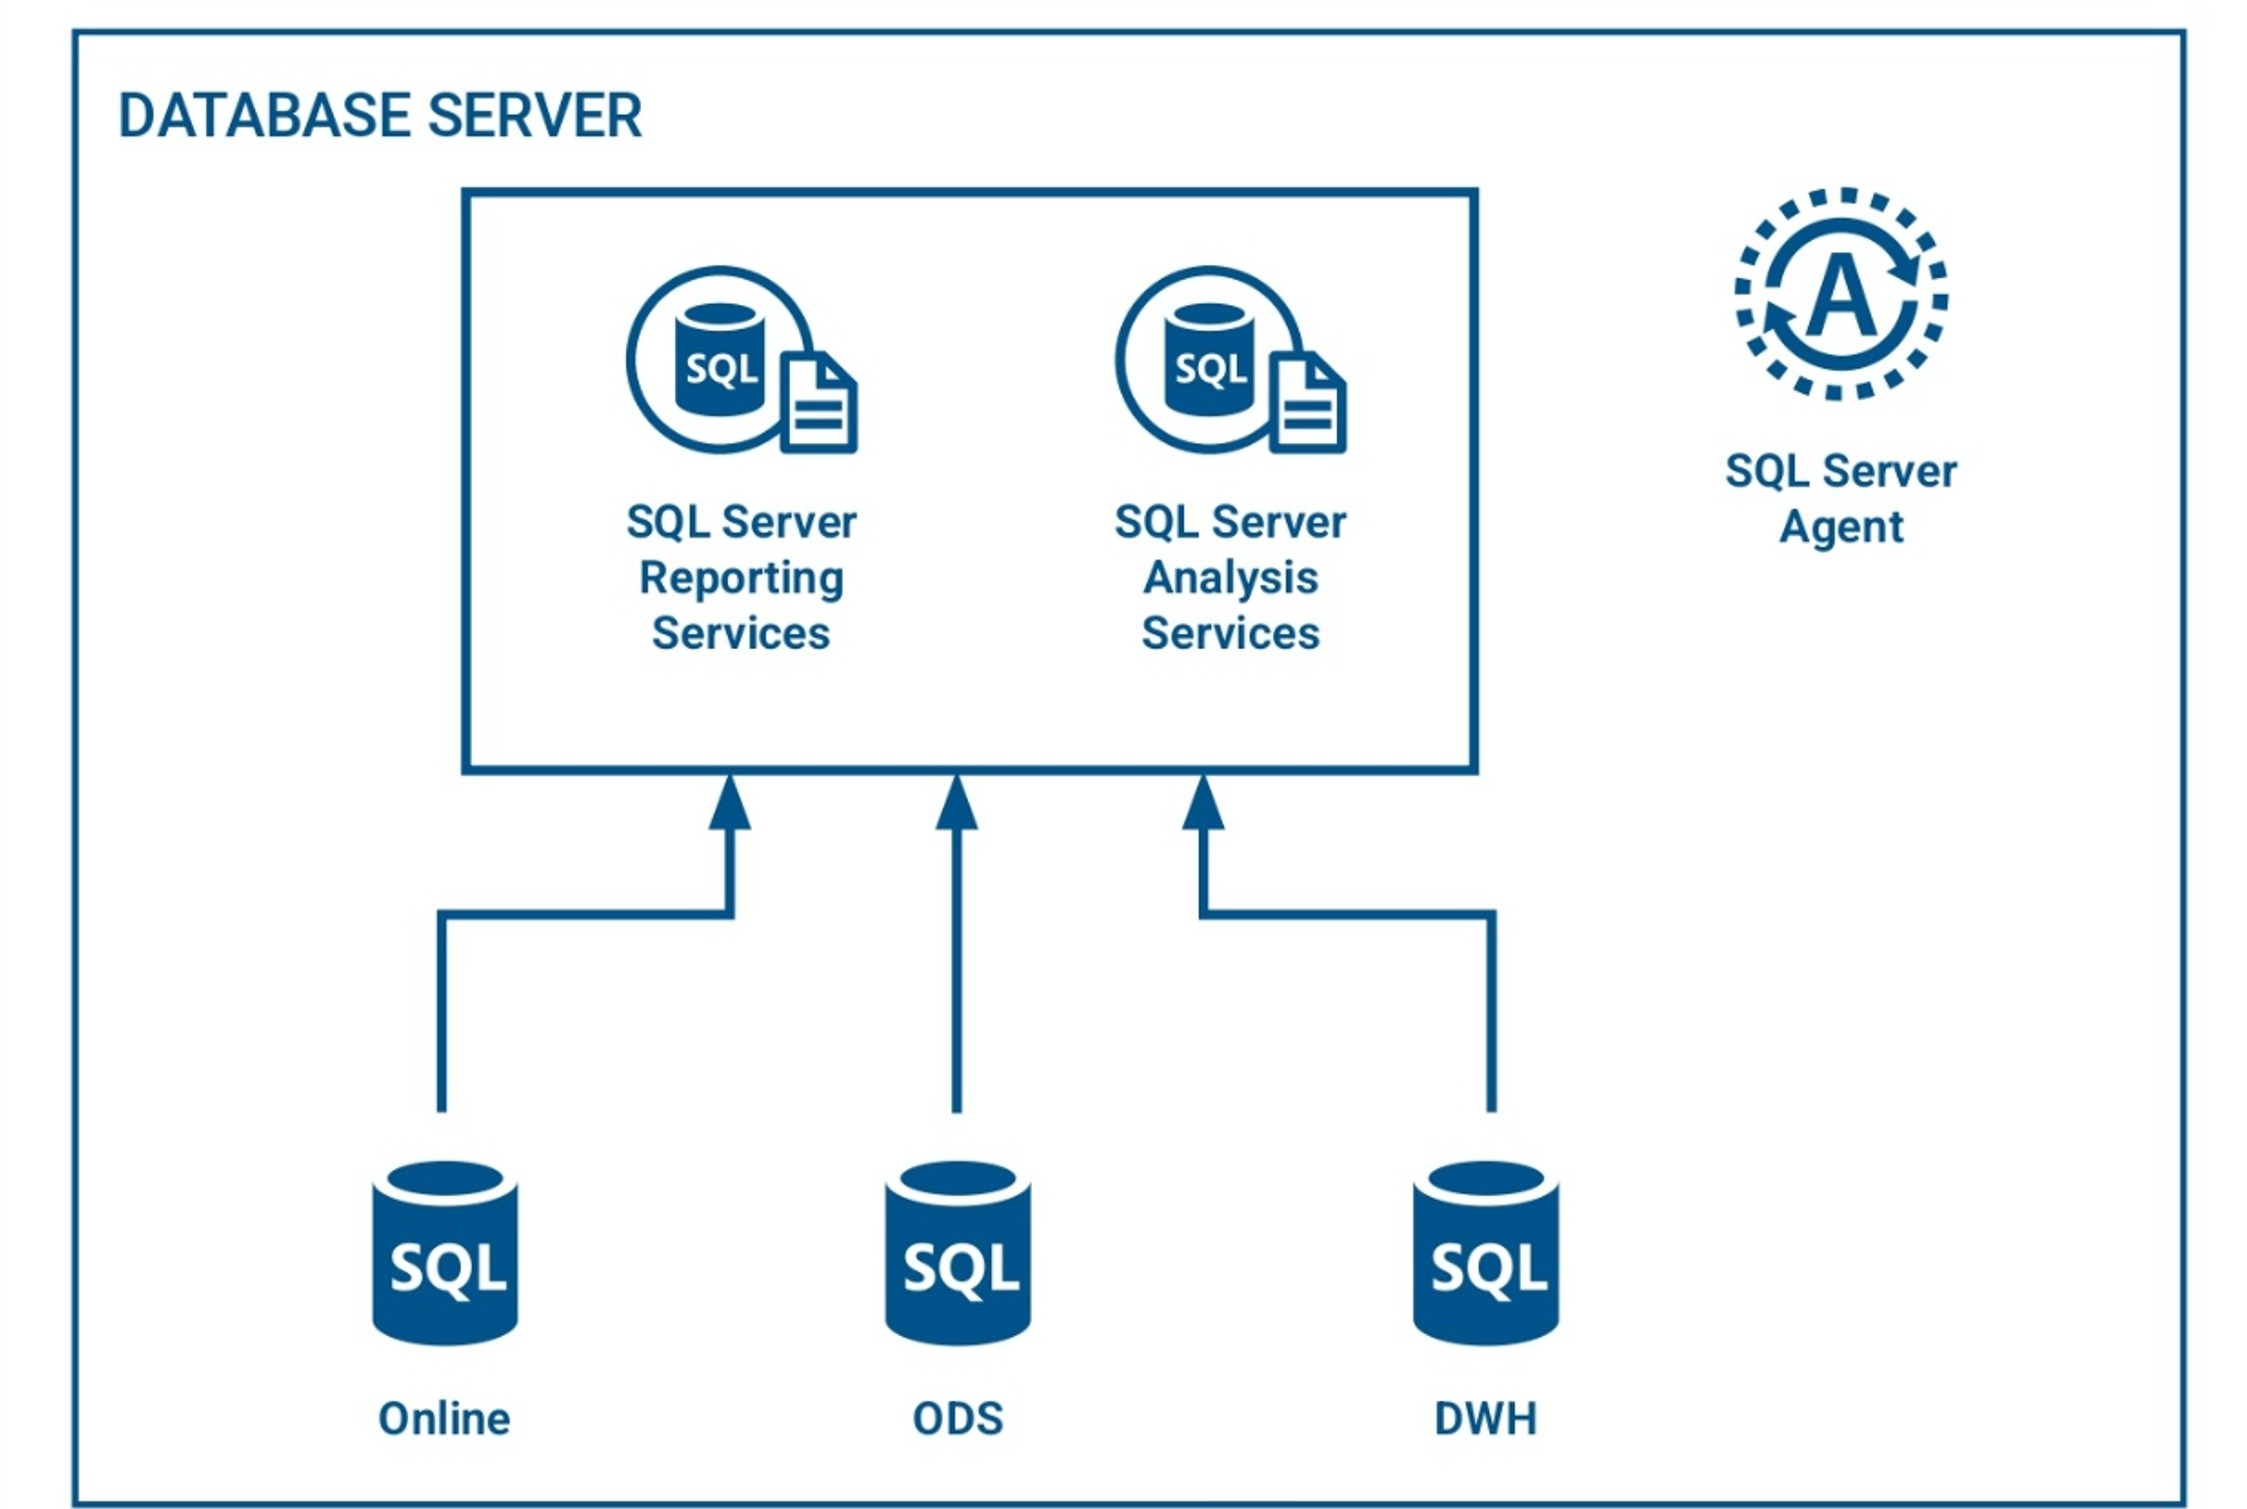
All three on SQL Server, ideally on separate instances so a bad report can’t slow down the shop floor.
Moving data between them was a SQL Server Agent job with four steps: check AlwaysOn status, generate the insert/update statements for anything new or changed, apply them, sleep, repeat. The DWH side did the same idea at a different scale — 65 steps to build dimensions, aggregations, and run the SSAS cube process. SQL Server Reporting Services (SSRS) sat on top, rendering paginated, server-defined reports; SQL Server Analysis Services (SSAS) handled the cube processing that made those reports fast.
It worked. It also meant every report was, transitively, a SQL Server problem — and every performance complaint eventually became a “which of these 65 steps is stuck” investigation.
The new way: an event-driven pipeline built on ClickHouse#
The replacement is a full-on modern Data Platform: event-driven, columnar, and designed so reports never touch a transactional table directly.
The components:
- Data Manager — exposes ClickHouse data via OData. This is what Stimulsoft will use for report building.
- Housekeeper — replicates Online/ODS data into ClickHouse and runs the CDM (Canonical Data Manager) builder that populates the analytics-ready tables.
- Kafka — every stage of replication is a message on a topic. Nothing here is bespoke queuing; it’s stock Kafka.
- IoTEventProcessor — fans-out messages from a shared staging topic to per-event destination topics.
- ClickHouse — column-oriented, denormalized, built for the queries, reports actually run.
- Aggregation Engine — Dagster schedules, dbt executes the SQL models that turn CDM into DWH.
- Cube — exposes DWH data via GraphQL and REST, feeding Grafana, Power BI, or whatever else. Cube
Two databases worth knowing the names of: CDM (ClickHouse’s operational layer, roughly analogous to the old ODS) and DWH (still the aggregate layer, now populated exclusively from CDM rather than SQL Server directly).
The replication path, traced end to end#
Every change in MES still starts life as a row in the OutBoxQueue table, keyed by what the system calls a SHID (ServiceHistoryId) — the identifier for a change on MES. This table exists on both Online and ODS, and it’s the seam between the transactional world and everything downstream.
From there, two distinct paths diverge:
ODS replication. Housekeeper reads new SHIDs from the outbox and publishes them to a Kafka topic. It then turns around and consumes its own message, builds the full change payload, and republishes to a replication topic — which a consumer picks up and writes into ClickHouse ODS. Two topics doing what looks like one job is intentional: the first says “something changed, here’s where”; the second says “here’s the fully assembled row, go write it.”
CDM replication. Same starting point — Housekeeper reads the SHID — but instead of a dedicated replication topic, the message lands on a shared staging topic named {systemname}_dp_dataplatform_raw. This “bucket” topic isn’t a Kafka concept, just a naming convention: it’s where every CDM-bound change lands, including messages published directly by external systems calling the Post Event API. IoTEventProcessor consumes the bucket, if there’s any defined it executes data platform low code workflows, and fans each message out to a destination topic shaped {systemname}_{type}_{eventname}_raw. Housekeeper subscribes to all of them and writes the result into ClickHouse CDM.
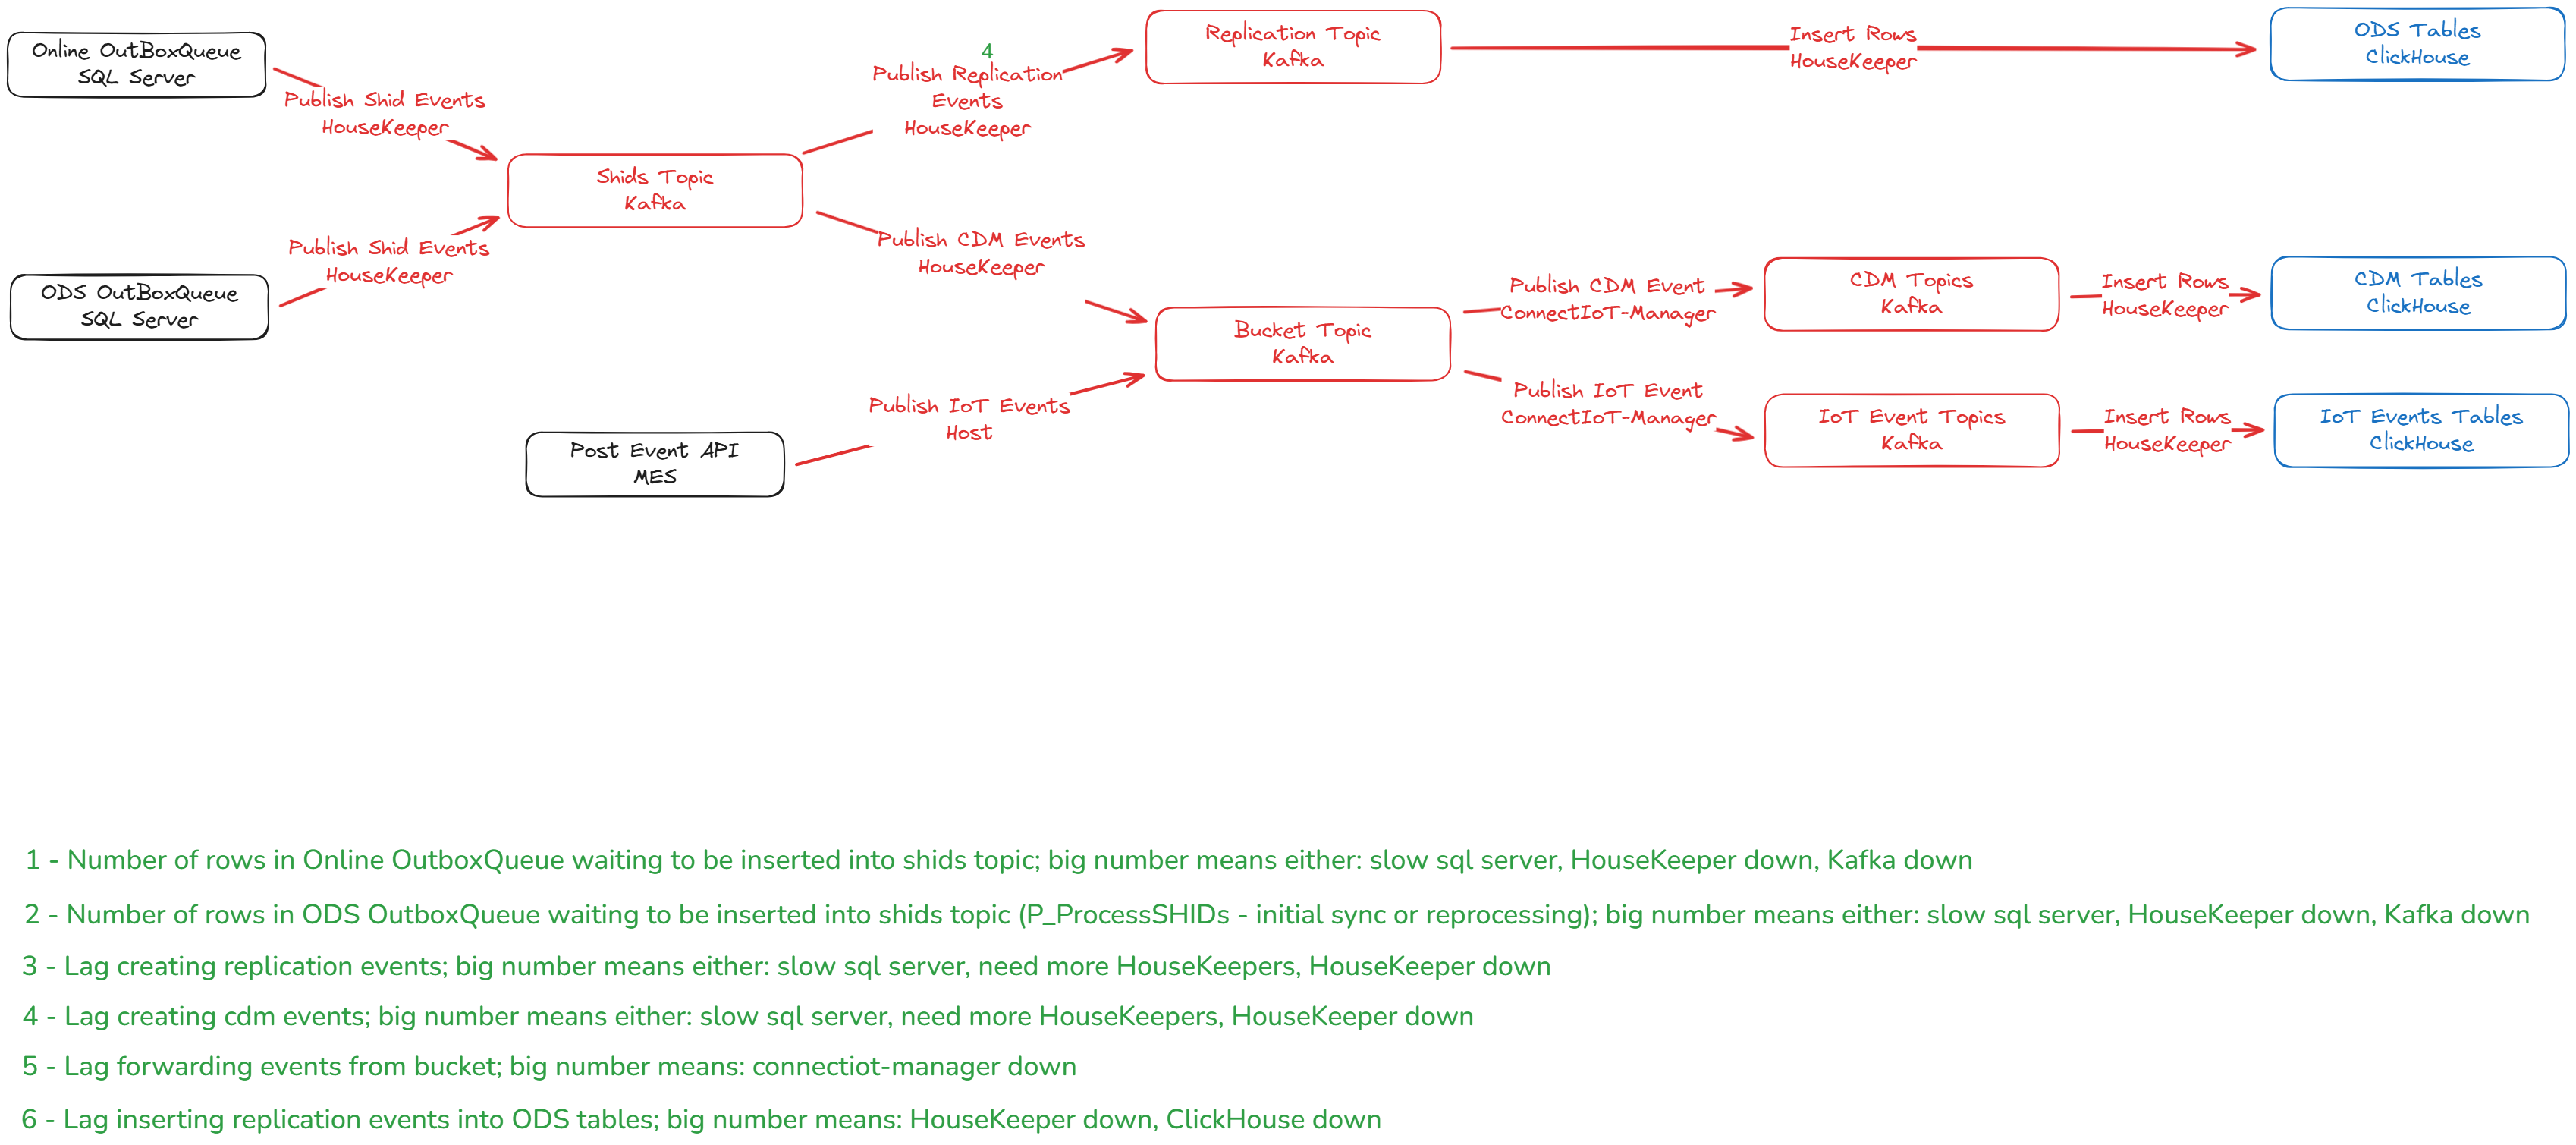
The practical upshot: if replication breaks, ODS and CDM fail differently, and you troubleshoot them differently. ODS has one predictable replication topic to inspect. CDM has as many topics as you have event types.
If IoTEventProcessor isn’t healthy, CDM replication silently stops fanning out, and nothing in the ODS job logs will tell you that.
Sanity checks that cost nothing#
Two habits pay for themselves immediately.
First: SQL Server and ClickHouse should have matching row counts for the same logical table. If they don’t, you have your answer before you’ve written a single diagnostic query.
Second: every ClickHouse row carries replication metadata SQL Server never had — _created_at, _SysProperties_EventId, _SysProperties_EnqueueTime, _AppProperties_ApplicationName, _AppProperties_EventTime. When Housekeeper logs an error against a specific event ID, that ID is your thread back through Kafka to the exact message that broke — no need to guess which change caused it.
What actually changed in the tables#
The move to ClickHouse isn’t just a faster engine under the same schema, the schema itself is different in a way that matters for anyone writing queries against it.
SQL Server’s dynamic model gives every entity type seven tables: T_[name], T_[name]History, T_[name]Attribute, T_[name]AttributeHistory, T_[name]OperationAttribute, T_[name]State, T_[name]StateHistory. Normalized, foreign-keyed, correct for a system of record.
ClickHouse collapses most of that into two tables: [Schema]_T_[name] and [Schema]_T_[name]History. Attributes live in a JSON column (_Attributes) instead of a separate table. State model information lives directly in columns like MainStateModelId and MainStateModelState. Foreign keys to other entities — Step, Product, Facility — get embedded as JSON snapshots instead of requiring a join.
That’s denormalization done deliberately, not sloppily — the design goal is that a report can get 80% of what it needs about a related entity without a join, and reach for the join only when it genuinely needs deeper detail than the snapshot carries.
Data Sets and Analytics Views: the new access layer#
Two concepts sit between raw ClickHouse tables and an actual report, and the mental model shift here trips people coming from SSRS.
A Data Set is a SQL SELECT against the ClickHouse model, exposed as a tabular, exportable object over OData — consumable from Stimulsoft, Excel, Power BI, or a Jupyter notebook, anything that speaks OData. A dataset for material data collections should include all materials; the caller filters down to the one they care about.
An Analytics View is the visualization layer on top — the JSON definition of a Stimulsoft report, build kpis or grafana dashboards, consuming one or more Data Sets, defining layout and presentation. Data Sets are the access layer; Analytics Views are the presentation layer. Keep that boundary clean and reports stay maintainable; blur it and you end up debugging report logic that’s actually a data problem, or vice versa.
The performance guidance for Data Sets is the same instinct that governs the ClickHouse schema itself: broad enough to cover everything a given analysis needs, focused enough that you’re not dragging in unrelated data. Too narrow and you’re stitching datasets together at query time; too wide and every column becomes weight the browser has to carry.
Stimulsoft vs. SSRS: where the trade-off actually lands#
SSRS renders server-side — the server pulls data, builds the report, and ships a finished document. Stimulsoft Reports.JS, is embedded in the MES UI, renders entirely client-side in the browser, fetching data itself over OData through Data Manager. No server-side rendering component to install or scale; but every byte of report data now travels to the browser, and every layout calculation happens on the client’s hardware.
That trade produces a specific, sharp set of constraints:
What you can do: open and edit report layouts directly in the browser, design and preview interactively, use Stimulsoft’s own expression syntax and built-in functions for dynamic values, apply conditional formatting.
What you can’t do: attach event scripts — no BeforePrint, no GetValue, nothing resembling the scripting hooks a desktop report designer would give you. No complex server-side processing; if a report needs a heavy aggregation, that aggregation belongs in the Data Set’s SQL, not in the report layer. No access to security or system-level settings from inside the designer, by design.
The honest way to frame this: SSRS gives you rigid layout with real server-side headroom. Stimulsoft gives you pixel-level design freedom with a hard ceiling set by whatever machine happens to be running the browser. Large or heavily nested reports will degrade, and there’s no server tier waiting to absorb the load. Pagination and deliberately narrow reports aren’t a workaround here — they’re the only lever you have.
Creating a Report#
The demo query set makes the OData filtering model concrete. Here’s a Data Set joining data collection instances to their reading points in ClickHouse:
SELECT
    JSONExtractString(i.Material, 'Name') AS Material,
    JSONExtractString(p.SourceEntity, 'Name') AS DataCollectionInstance,
    JSONExtractString(p.TargetEntity, 'Name') AS ParameterName,
    p.Value
FROM CoreDataModel_T_DataCollectionInstance AS i
JOIN CoreDataModel_T_DataCollectionPoint AS p
    ON i.DataCollectionInstanceId = JSONExtractInt(p.SourceEntity, 'Id')
WHERE i._OperationHistory_OperationName = 'PerformImmediate'
ORDER BY i.CreatedOn ASC;
Note JSONExtractString pulling the material name straight out of the embedded JSON snapshot — no join to the material table required, exactly the payoff the denormalized schema is there for.
A second dataset covers genealogy consumption events. Both are useful on their own, but a report showing “everything that happened to this material” needs them side by side — and naively joining two differently-shaped event tables produces a table with half its columns null on every row. The fix is a UNION ALL with each dataset reshaped into (Key, Value) pairs via ARRAY JOIN, so heterogeneous events share a uniform shape:
SELECT
    JSONExtractString(i.Material, 'Name')     AS Material,
    'DataCollection'                          AS EventType,
    i.CreatedOn                               AS CreatedOn,
    JSONExtractString(p.TargetEntity, 'Name') AS Key,
    toString(p.Value)                         AS Value
FROM CoreDataModel_T_DataCollectionInstance AS i
JOIN CoreDataModel_T_DataCollectionPoint AS p
    ON i.DataCollectionInstanceId = JSONExtractInt(p.SourceEntity, 'Id')
UNION ALL
SELECT
    JSONExtractString(g.DescMaterial, 'Name') AS Material,
    'Assemble'                                AS EventType,
    g.CreatedOn                               AS CreatedOn,
    kv.1                                      AS Key,
    kv.2                                       AS Value
FROM CoreDataModel_T_Genealogy AS g
ARRAY JOIN
    [
        ('ConsumableMaterial', JSONExtractString(g.AscMaterial, 'Name')),
        ('AssembledQty',       toString(g.AscAssembledPrimaryQty))
    ] AS kv
WHERE g.Operation ILIKE '%Assemble%'
ORDER BY CreatedOn ASC;
One Data Set, one Stimulsoft data source, one HTTP call to Data Manager. Inside the report, each table applies its own client-side filter on EventType — data collection in one band, Assemble in another — instead of firing a second call for a second dataset.
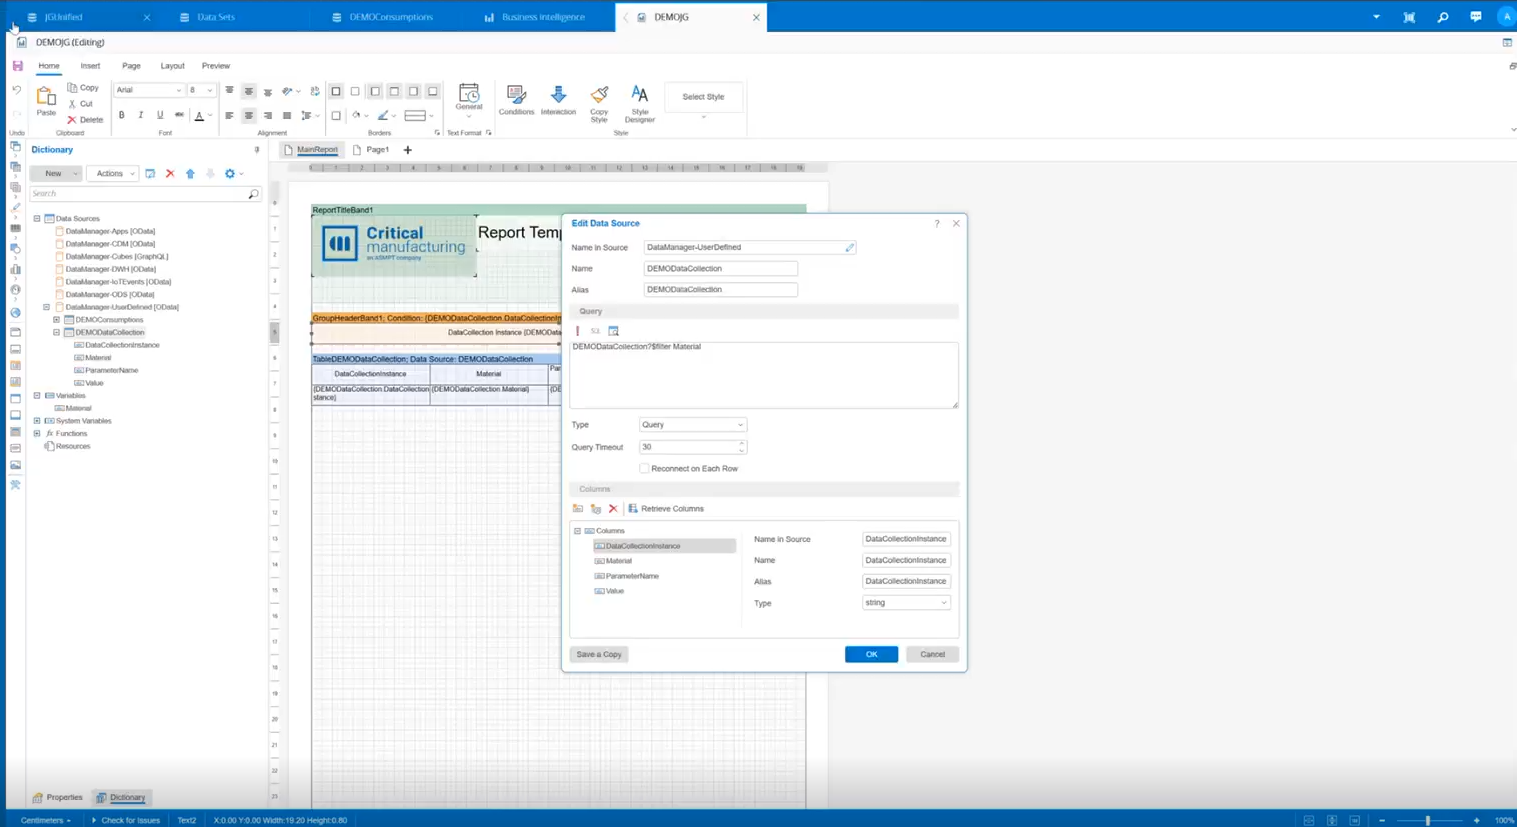
We created our queries and turned them into datasets that the MES knows. Now they are fully available to be used on building our Stimulsoft report.
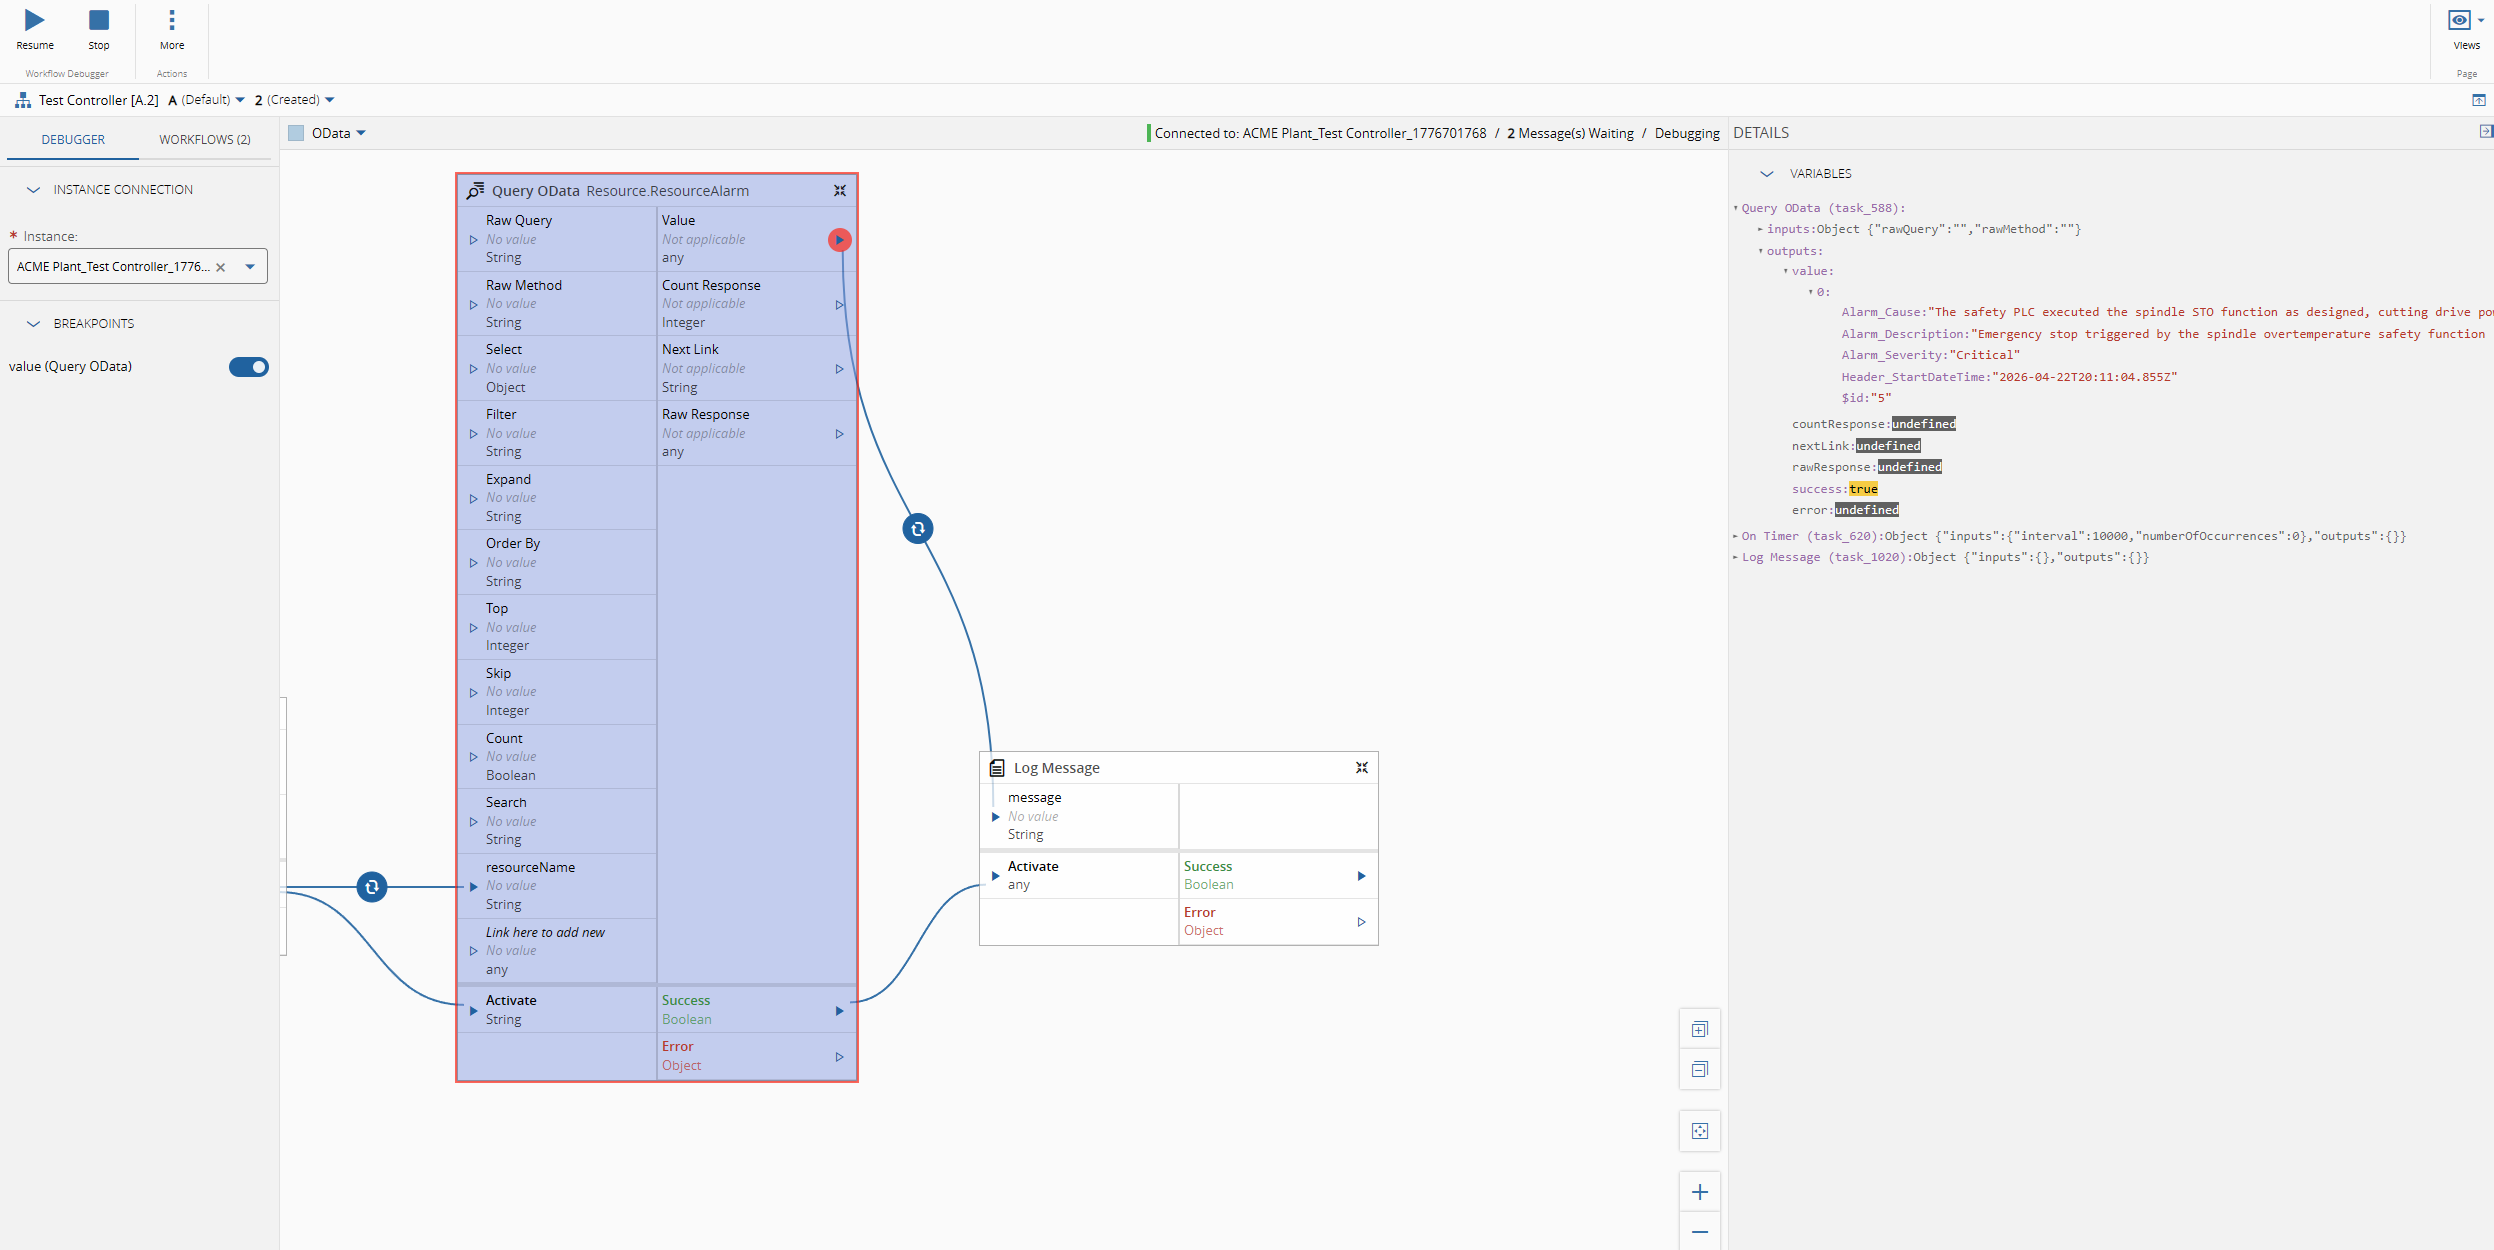
In the report we have full access to all the default datasets and also to our new custom datasets. We can see that what is happening behind the scenes is that we are doing OData requests to the data-manager.
Final thoughts#
We have a new tool not just for designing reports. We have a totally revamped architecture to change what used to take minutes into seconds a totally reshape of the way to interact with the system.