In version 11.2 there was a big revamp of the Connect IoT designer. We have pushed even further in version 11.2 and have fully revamped the IoT Remote Debugger and Profiler.
Overview#
One of the common issues of handling on-edge applications is to have visibility and control. CM already provides a lot of support for visibility and control. We have covered observability Edge Observability and have shown control through our use cases where we have been stopping and starting all our on-edge managers through the GUI, we have also done a presentation that covered some of this in the MESi 4.0 - Good things come in small packages Unlock value by solving small form factor device challenges where we had an Automation Manager Controller running inside a Microshift cluster and we were handling the full deploy and update cycle, directly from the MES.
In this blog post we want to cover two features that are directly embedded in the CM MES UI and that can be very helpful to quickly troubleshoot issues, either in a development setting or on a production setting.
Profiler#
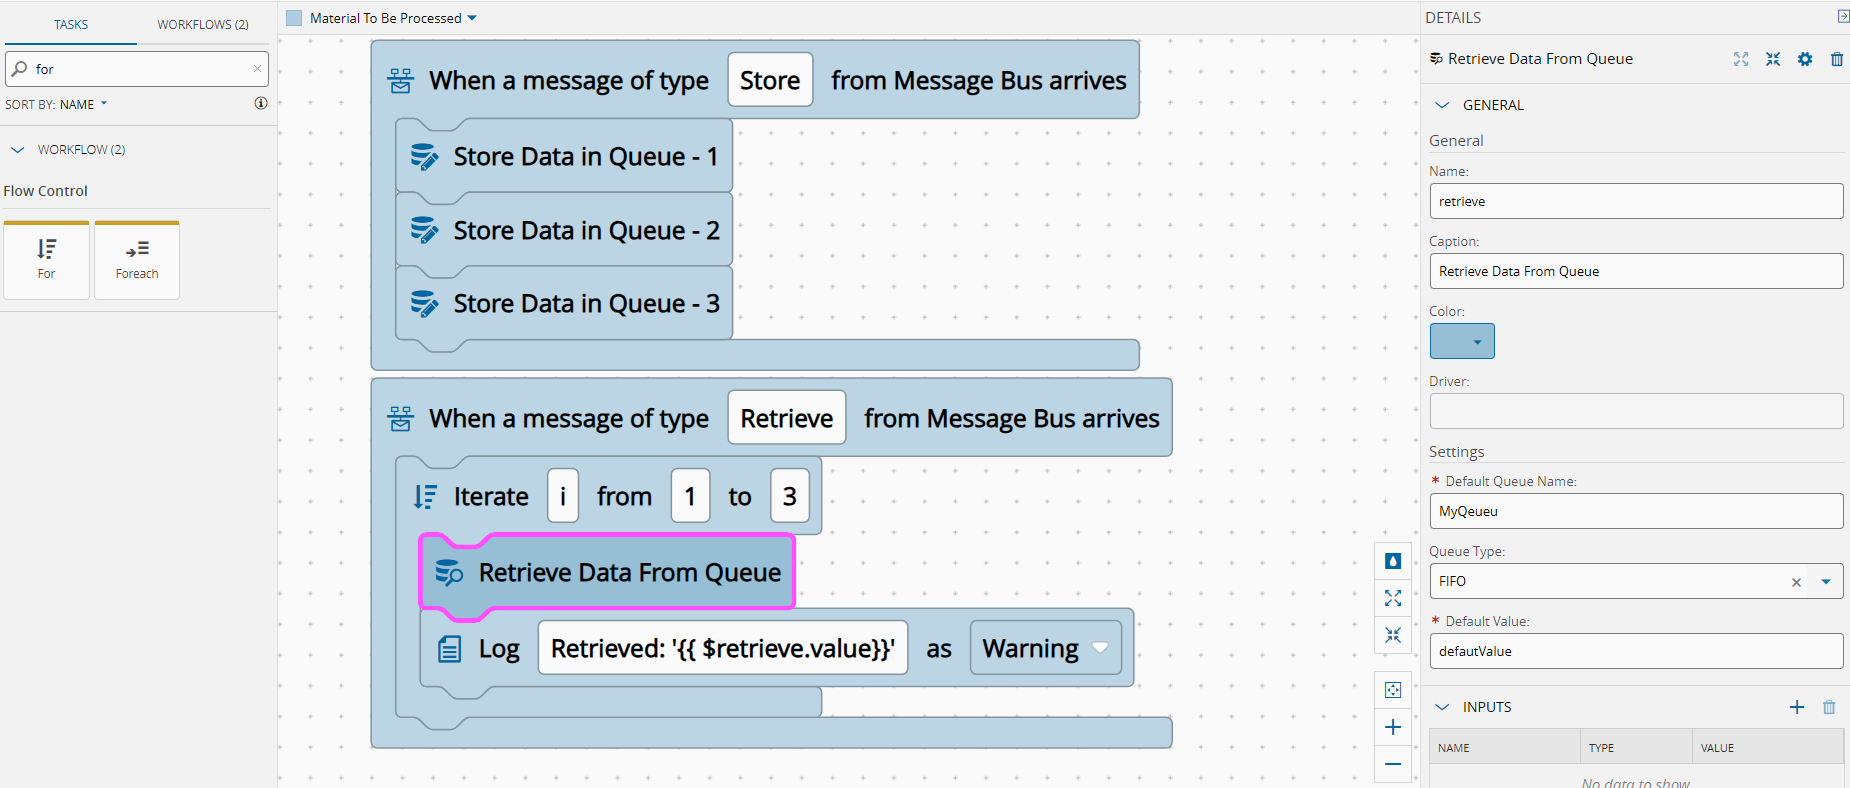
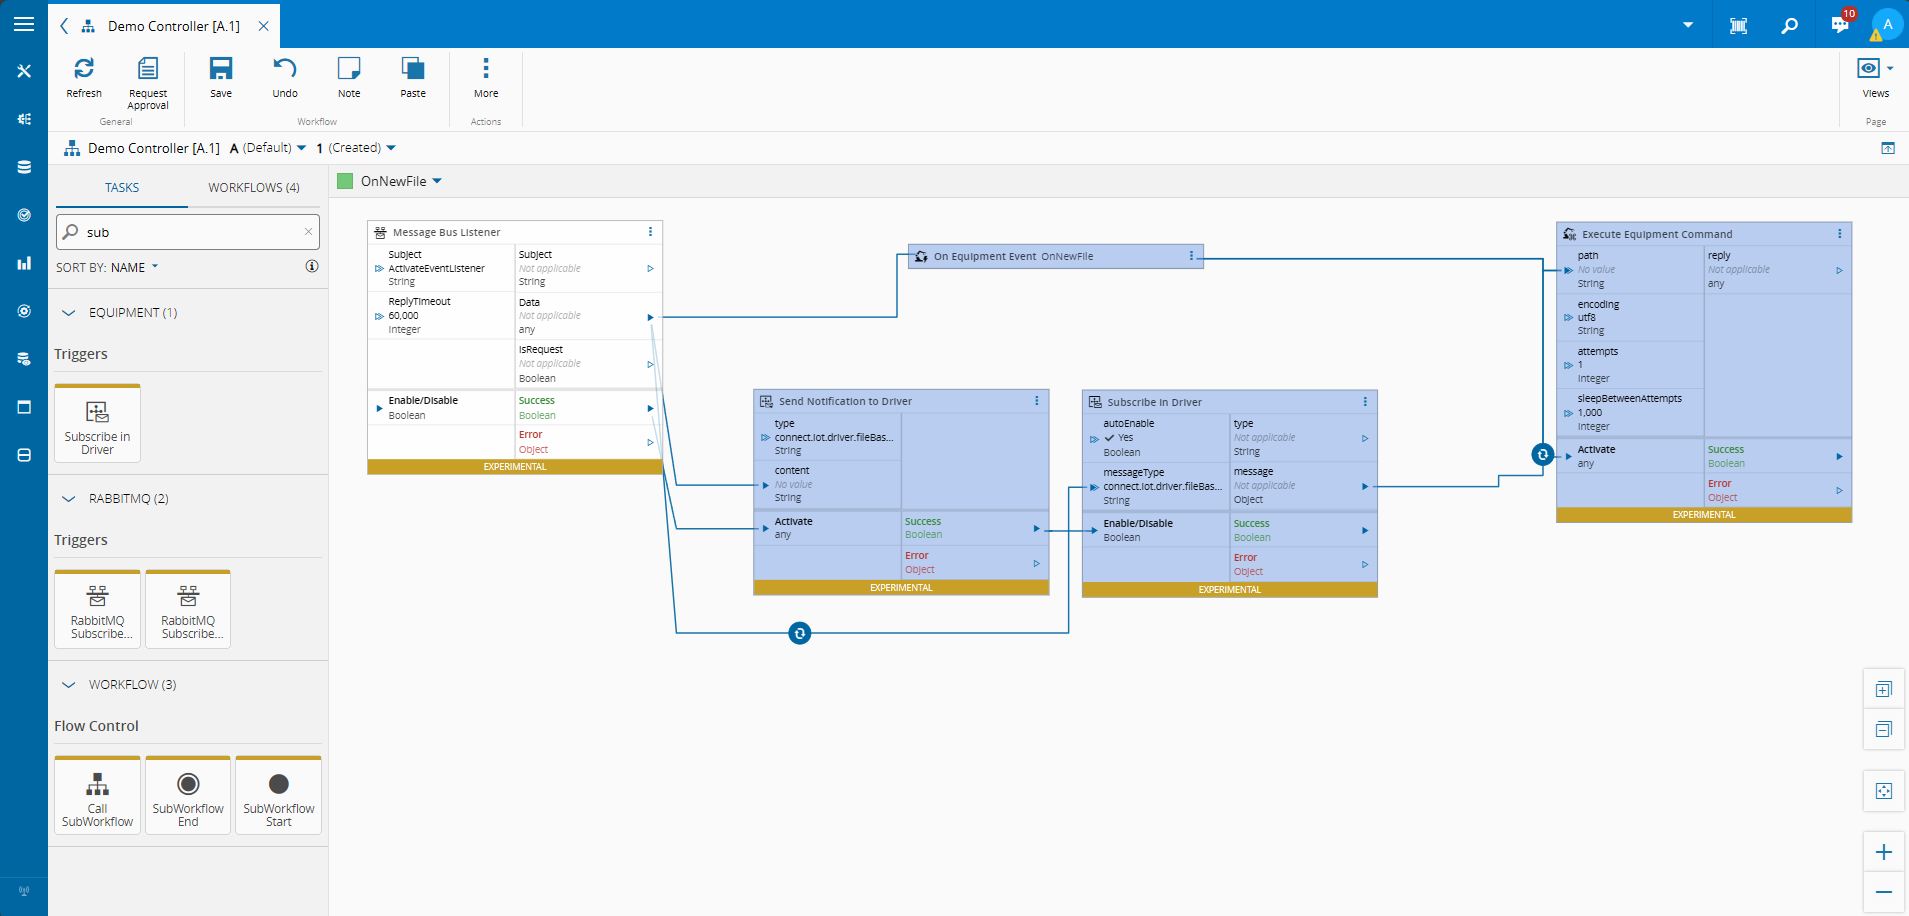
We created a very simple Connect IoT Workflow. It is monitoring a folder and whenever a file is dropped in a folder it will read the content of the file, log it and delete the file. When the file is deleted an event is triggered signaling that a file was deleted.
The profiler is a very useful tool that works directly in the Automation Controller page. It allows for the user to record everything that is happening in a set of workflow pages. The user will see a step by step of all the actions that occurred during the start and stop time of the profiler. The user can then travel through the runtime execution, forwards or backwards.
The execution can be recorded to a file by adding it in the Automation Manager Configuration, or by default it will export to the ${temp}/ConnectIoT/ProfilerSessions folder. The profiler execution can then be imported in the Automation Controller page and executed.
{
	"id": "File Raw Manager",
	"cache": "${temp}/ConnectIoT/Cache",
	"hostName": "localhost",
	"monitorApplication": "${pwd}/monitor.js",
	"repository": {
		"type": "System"
	},
	"controller": {
    	"profilerSessionsLocation": "C:/temp/ProfilerSessions"
	},
...
In a production setting and even in development a robust logging strategy is a must in order to understand and pinpoint complex issues. With the ability to see a walkthrough of what is happening in the low code designer it is a much more intuitive experience.
Debugger#
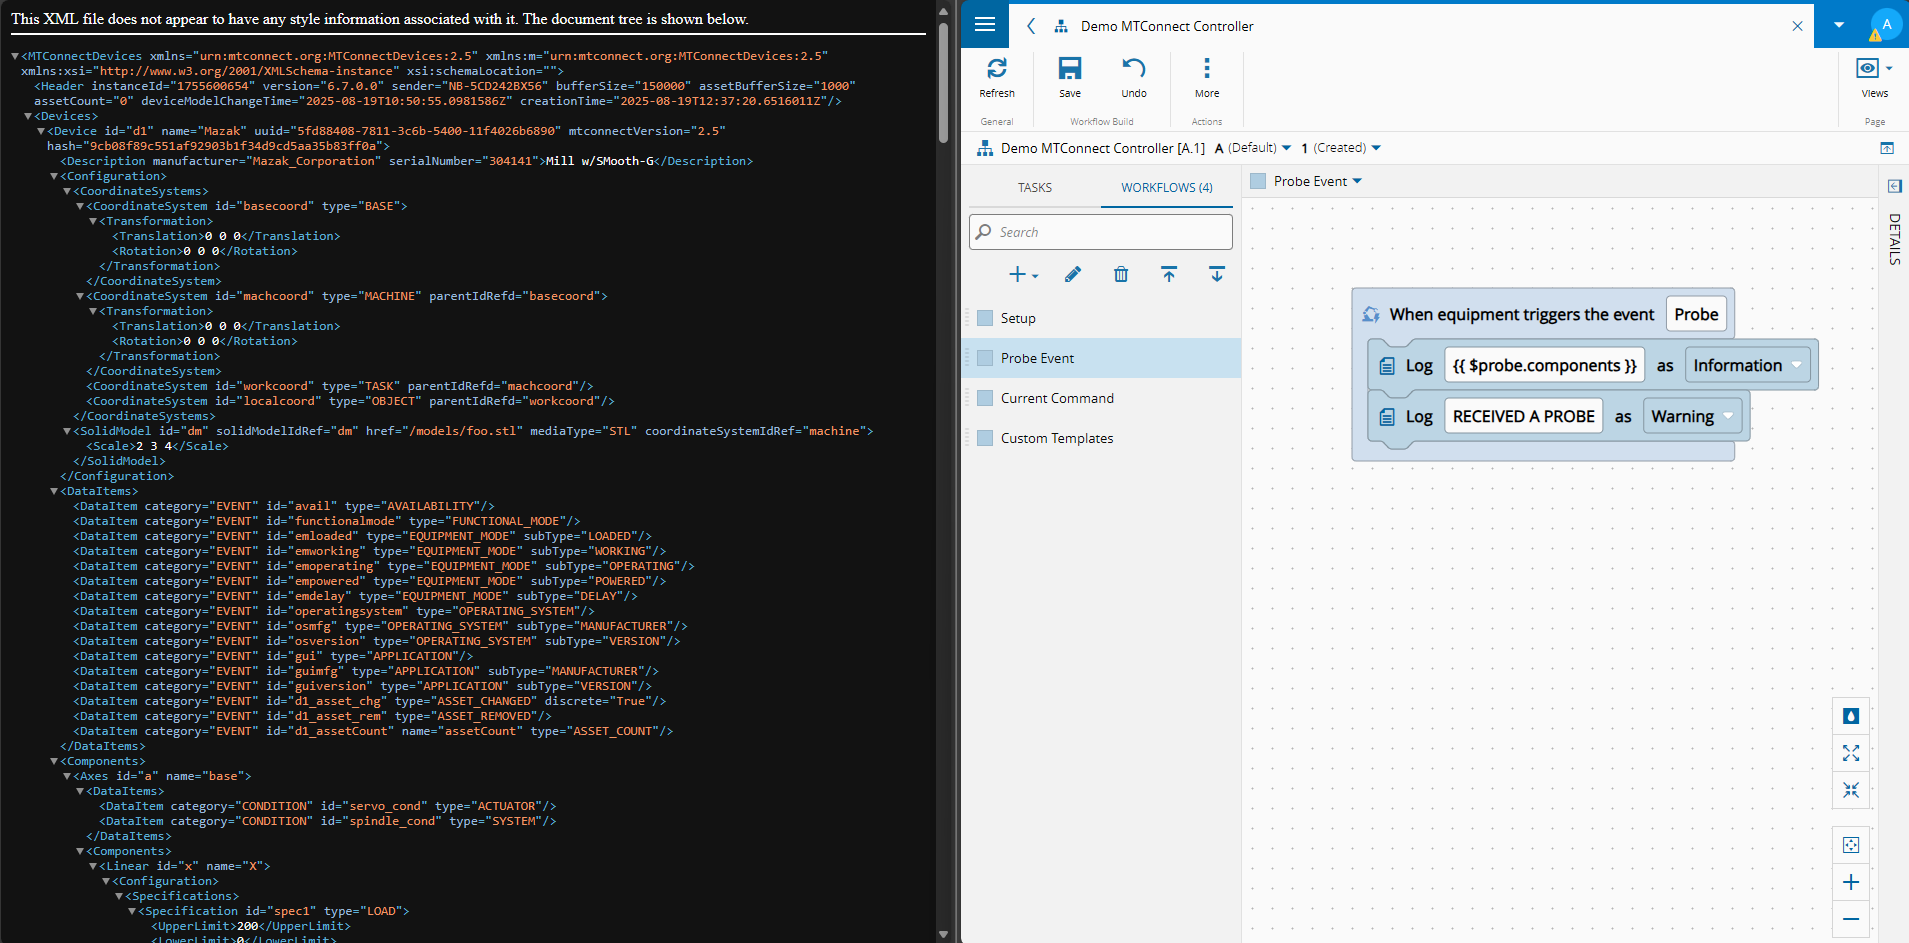
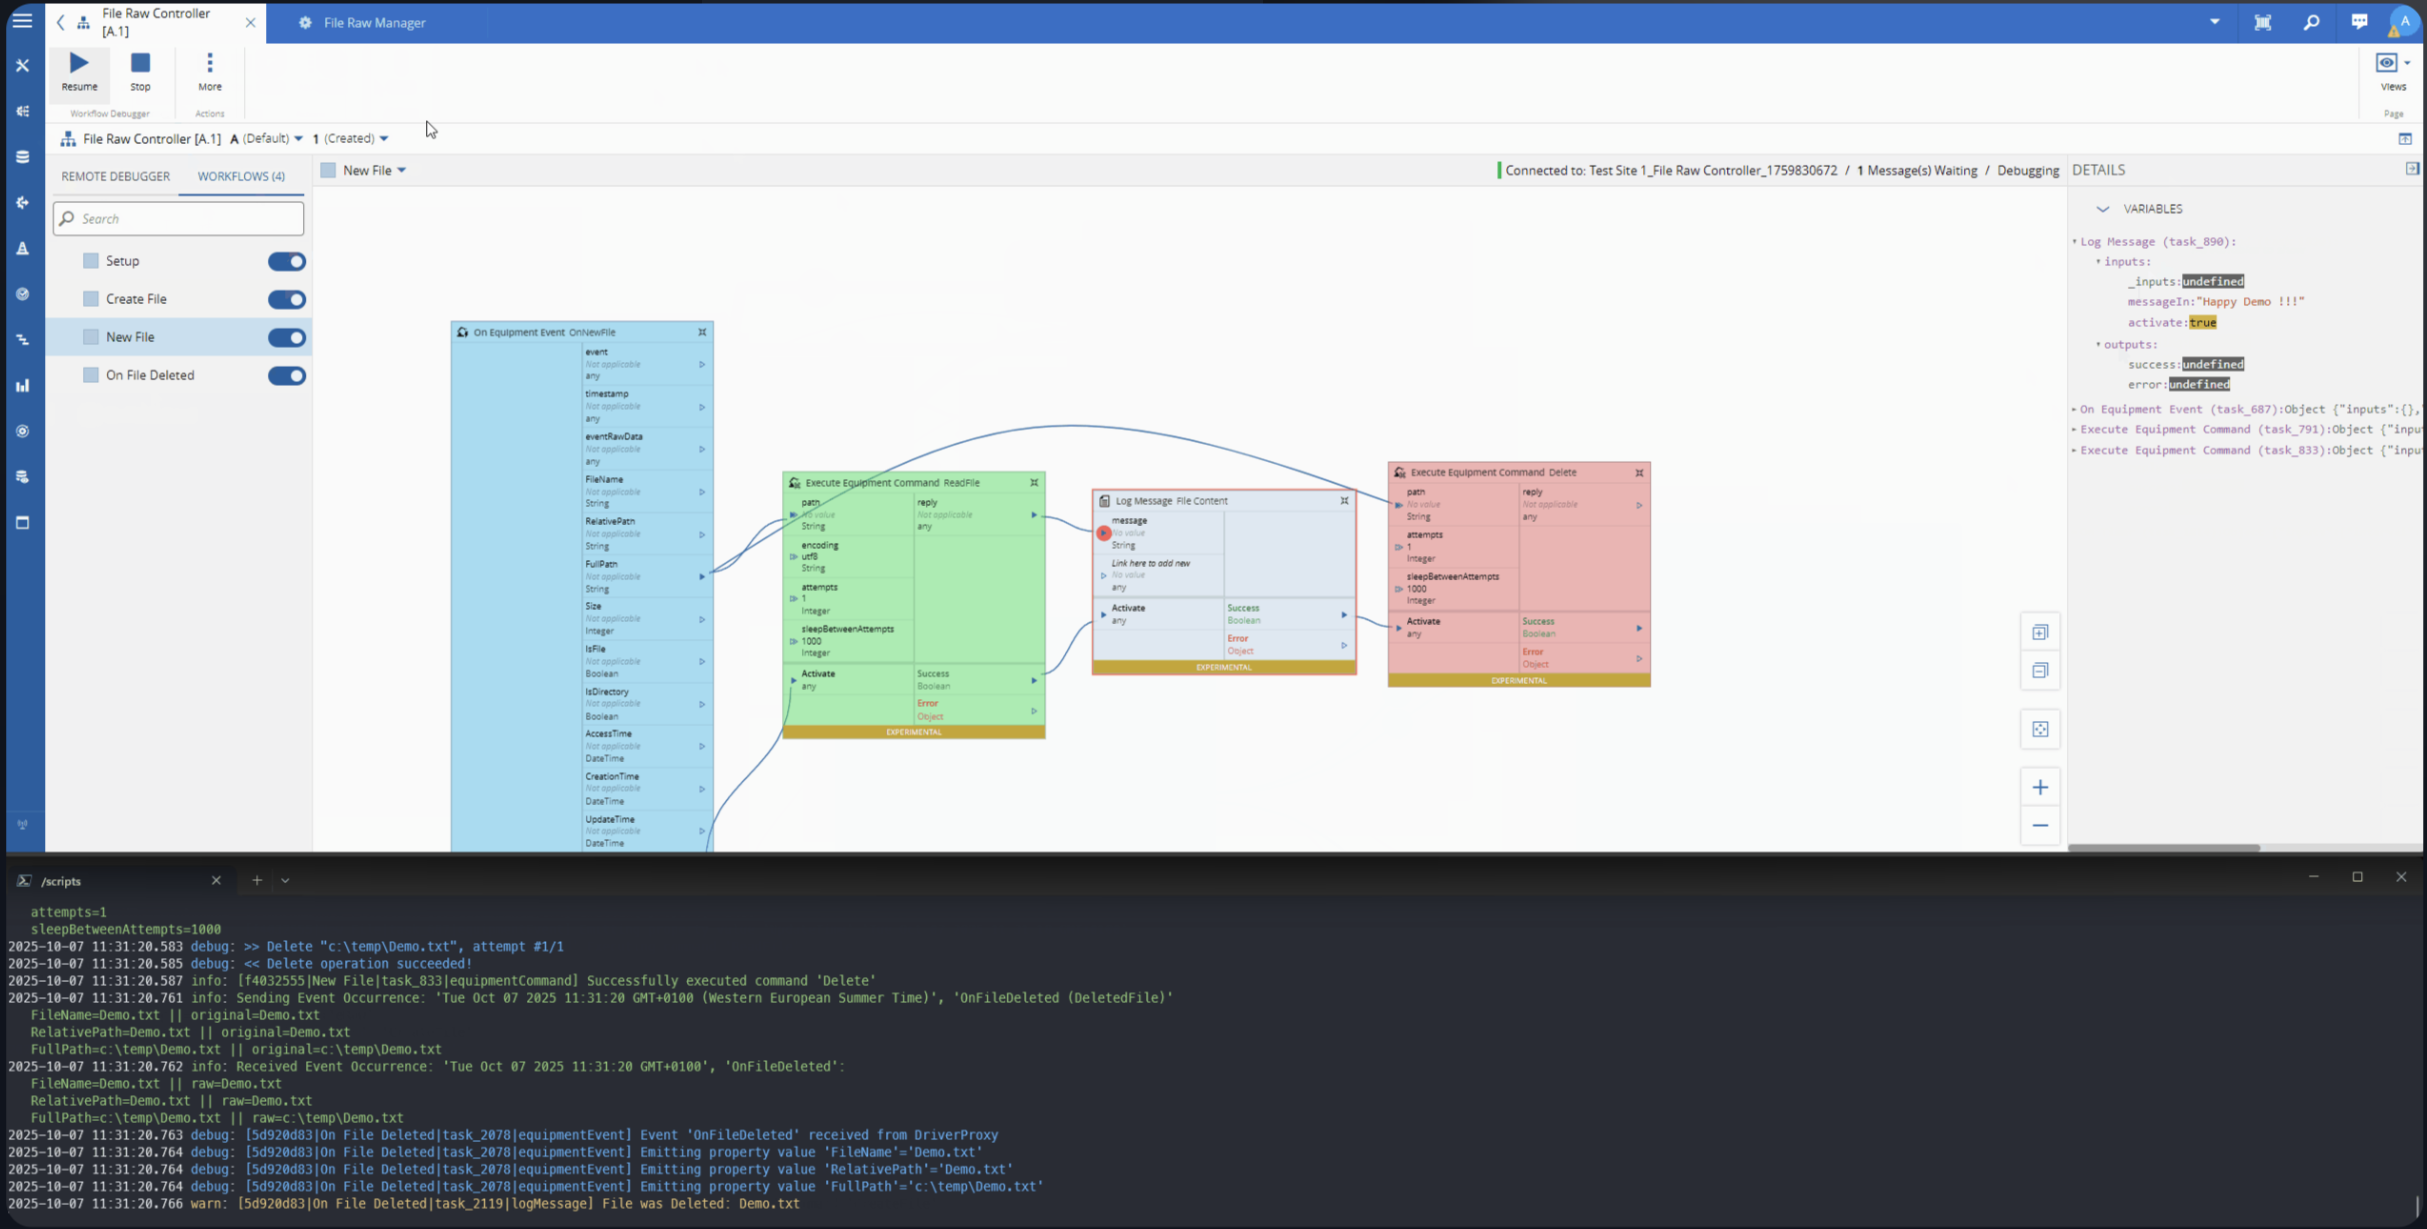
The debugger is also a very interesting feature, it allows for the UI to add breakpoints in the workflow designer,** without impacting the runtime**. In traditional debuggers a breakpoint will stop the application from continuing, here as we do not wish to negatively impact a running system we are able to follow the execution trace in the UI while the system continues to run.
Notice how we have two breakpoints and both are hit.
After finishing an executing and pressing Resume we already have a new breakpoint hit in the first breakpoint, this is due to the controller continuing to execute. The debugger will the execution from start to finish and then move on to the next execution.
Final Thoughts#
We are working to have the Connect IoT experience better each version. With the debugger and profiler we have added more transparency and easy visualization, bringing what is running on edge closer to what the low code developer is viewing.