A small use case on using MQTT and TCP-IP drivers for material tracking and resource state management.
Overview#
Previous use cases were very light on control, the greatest advantage of an MES system is not just the ability to collect information and provide context or generate reports, but more importantly to have actionable control.
Therefore, for this use case I chose to use a very simple, but common scenario where we have full automation for material tracking and resource state management. The twist, and it’s a very common twist, is that the control is done when we bring two different data producing interfaces and use the MES to provide context and control.
In this example, MQTT will provide humidity and temperature control, if the values are above a particular threshold, it will send the machine into a SEMI-E10 Unscheduled Down.
Meanwhile, the TCP-IP interface is only concerned in controlling the material tracking through the machine. But what happens if we get an event saying that the material is in process, while the machine is an undue state due to an invalid temperature or humidity?
We are going to find out!!!
We will then use this opportunity to backtrace what is happening through the native logging support and then to our subscription based observability platform.
MES Model Overview#
For this scenario we will have a resource Wafer Preparation Station Cleanroom which is handling materials Wafers:
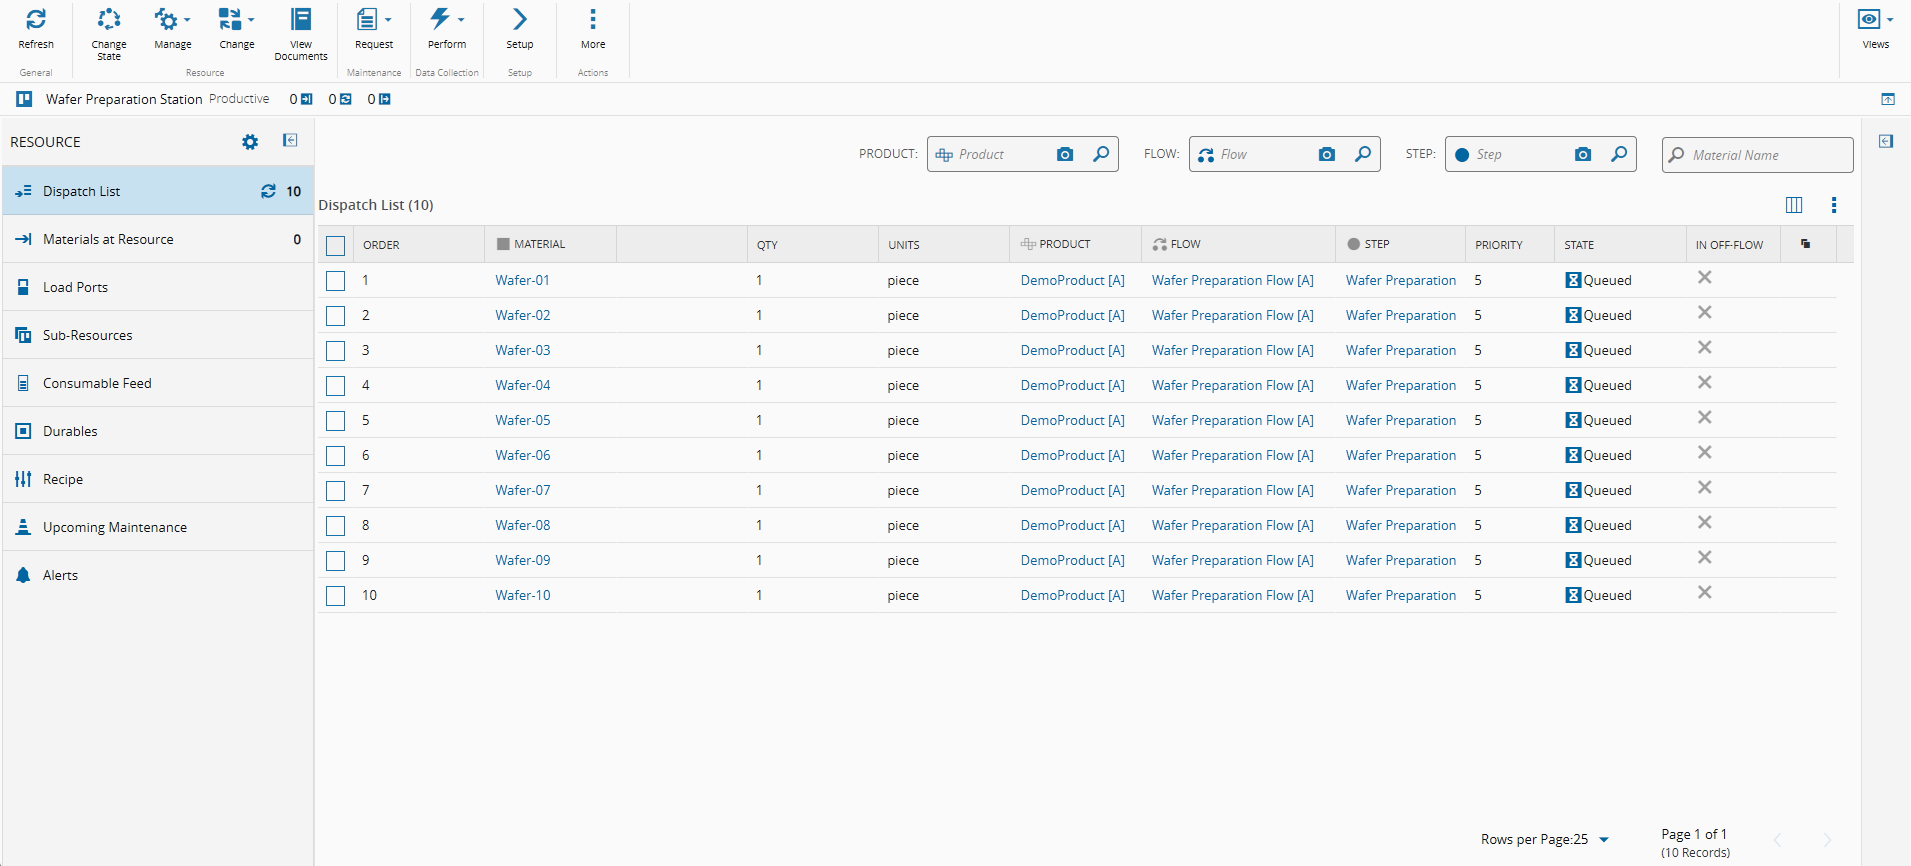
Resource View:
When interacting with our Resource this is one of the most important views. In the left tab we can see that we are currently in the Dispatch List and we have 10 Materials (10 wafers) that are dispatchable to this Resource.
There is also additional information that refers to other actions and views on the Resource, like if the resource has Load Ports, Sub-Resources, Maintenances, and others which will not be relevant for our use case.
Area View:
Notice that for this area, we only have one step, but we could have N steps and for our single step we have only one resource, we could have N resources. Also, right away we see that we have 10 Materials (10 wafers) in our Step Wafer Preparation but currently those materials are not dispatched to our resource.

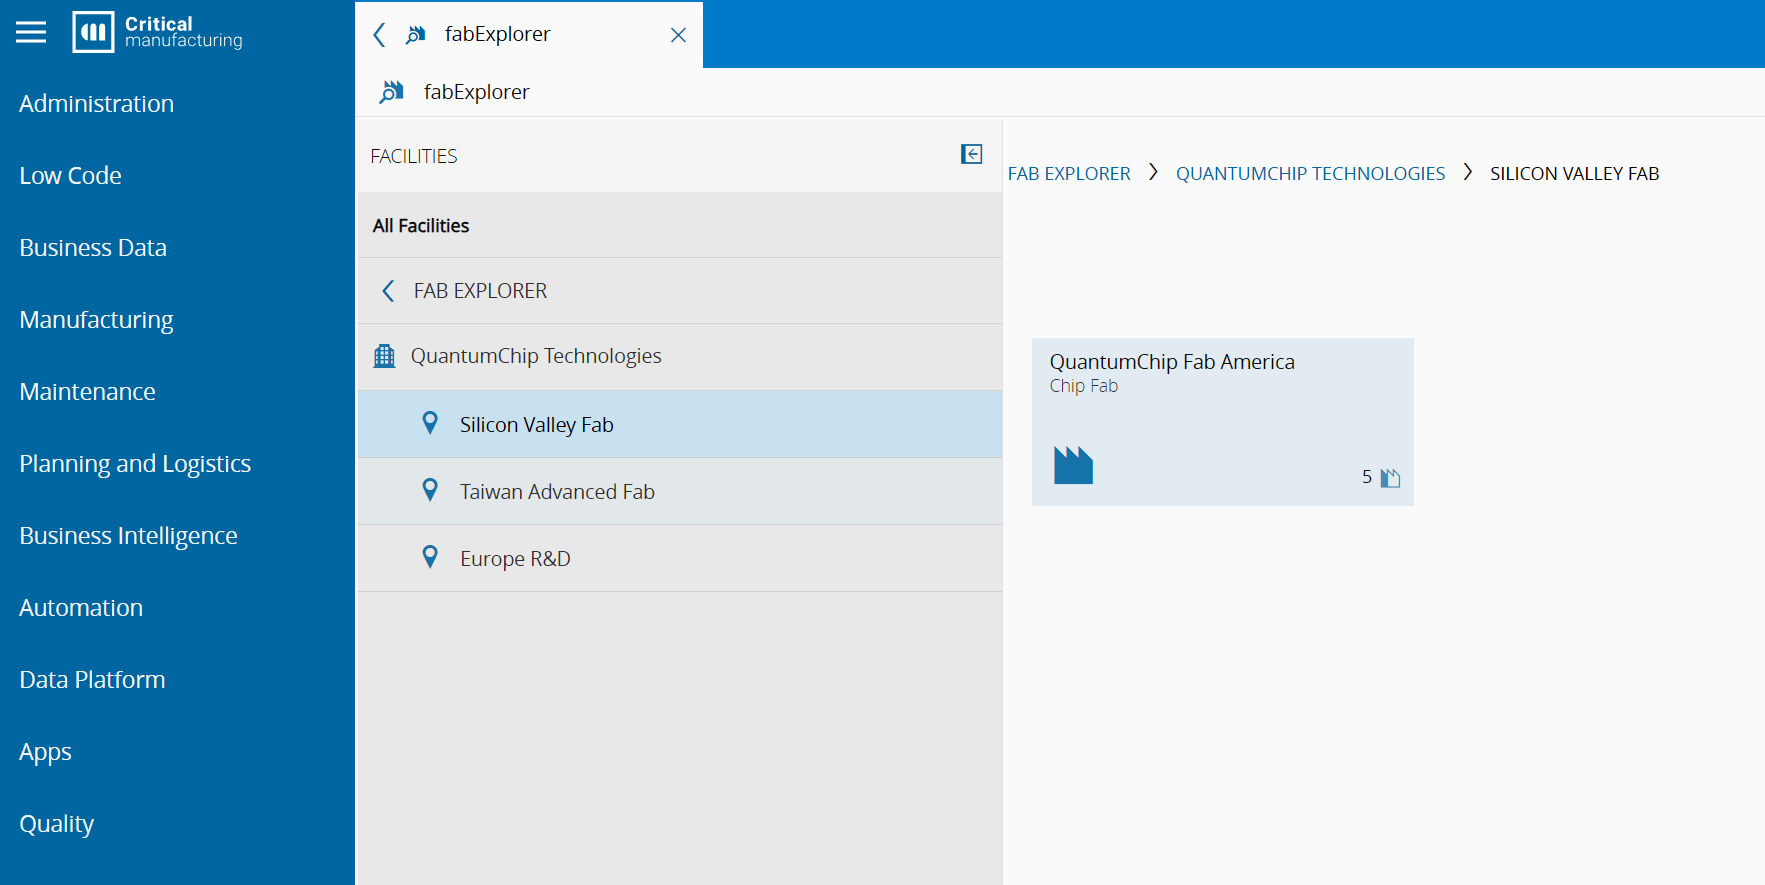
Facility View:

Factory Explorer:
There were other configurations that are relevant, like creating a product, defining a material flow, defining what services the resource provides. Explanations on these topics is out of scope for our goal today. Here are some helpful references to our documentation portal:
Create an Automation Protocol MQTT and TCP-IP#
For now, we will create them with the default settings.
MQTT Automation Protocol:
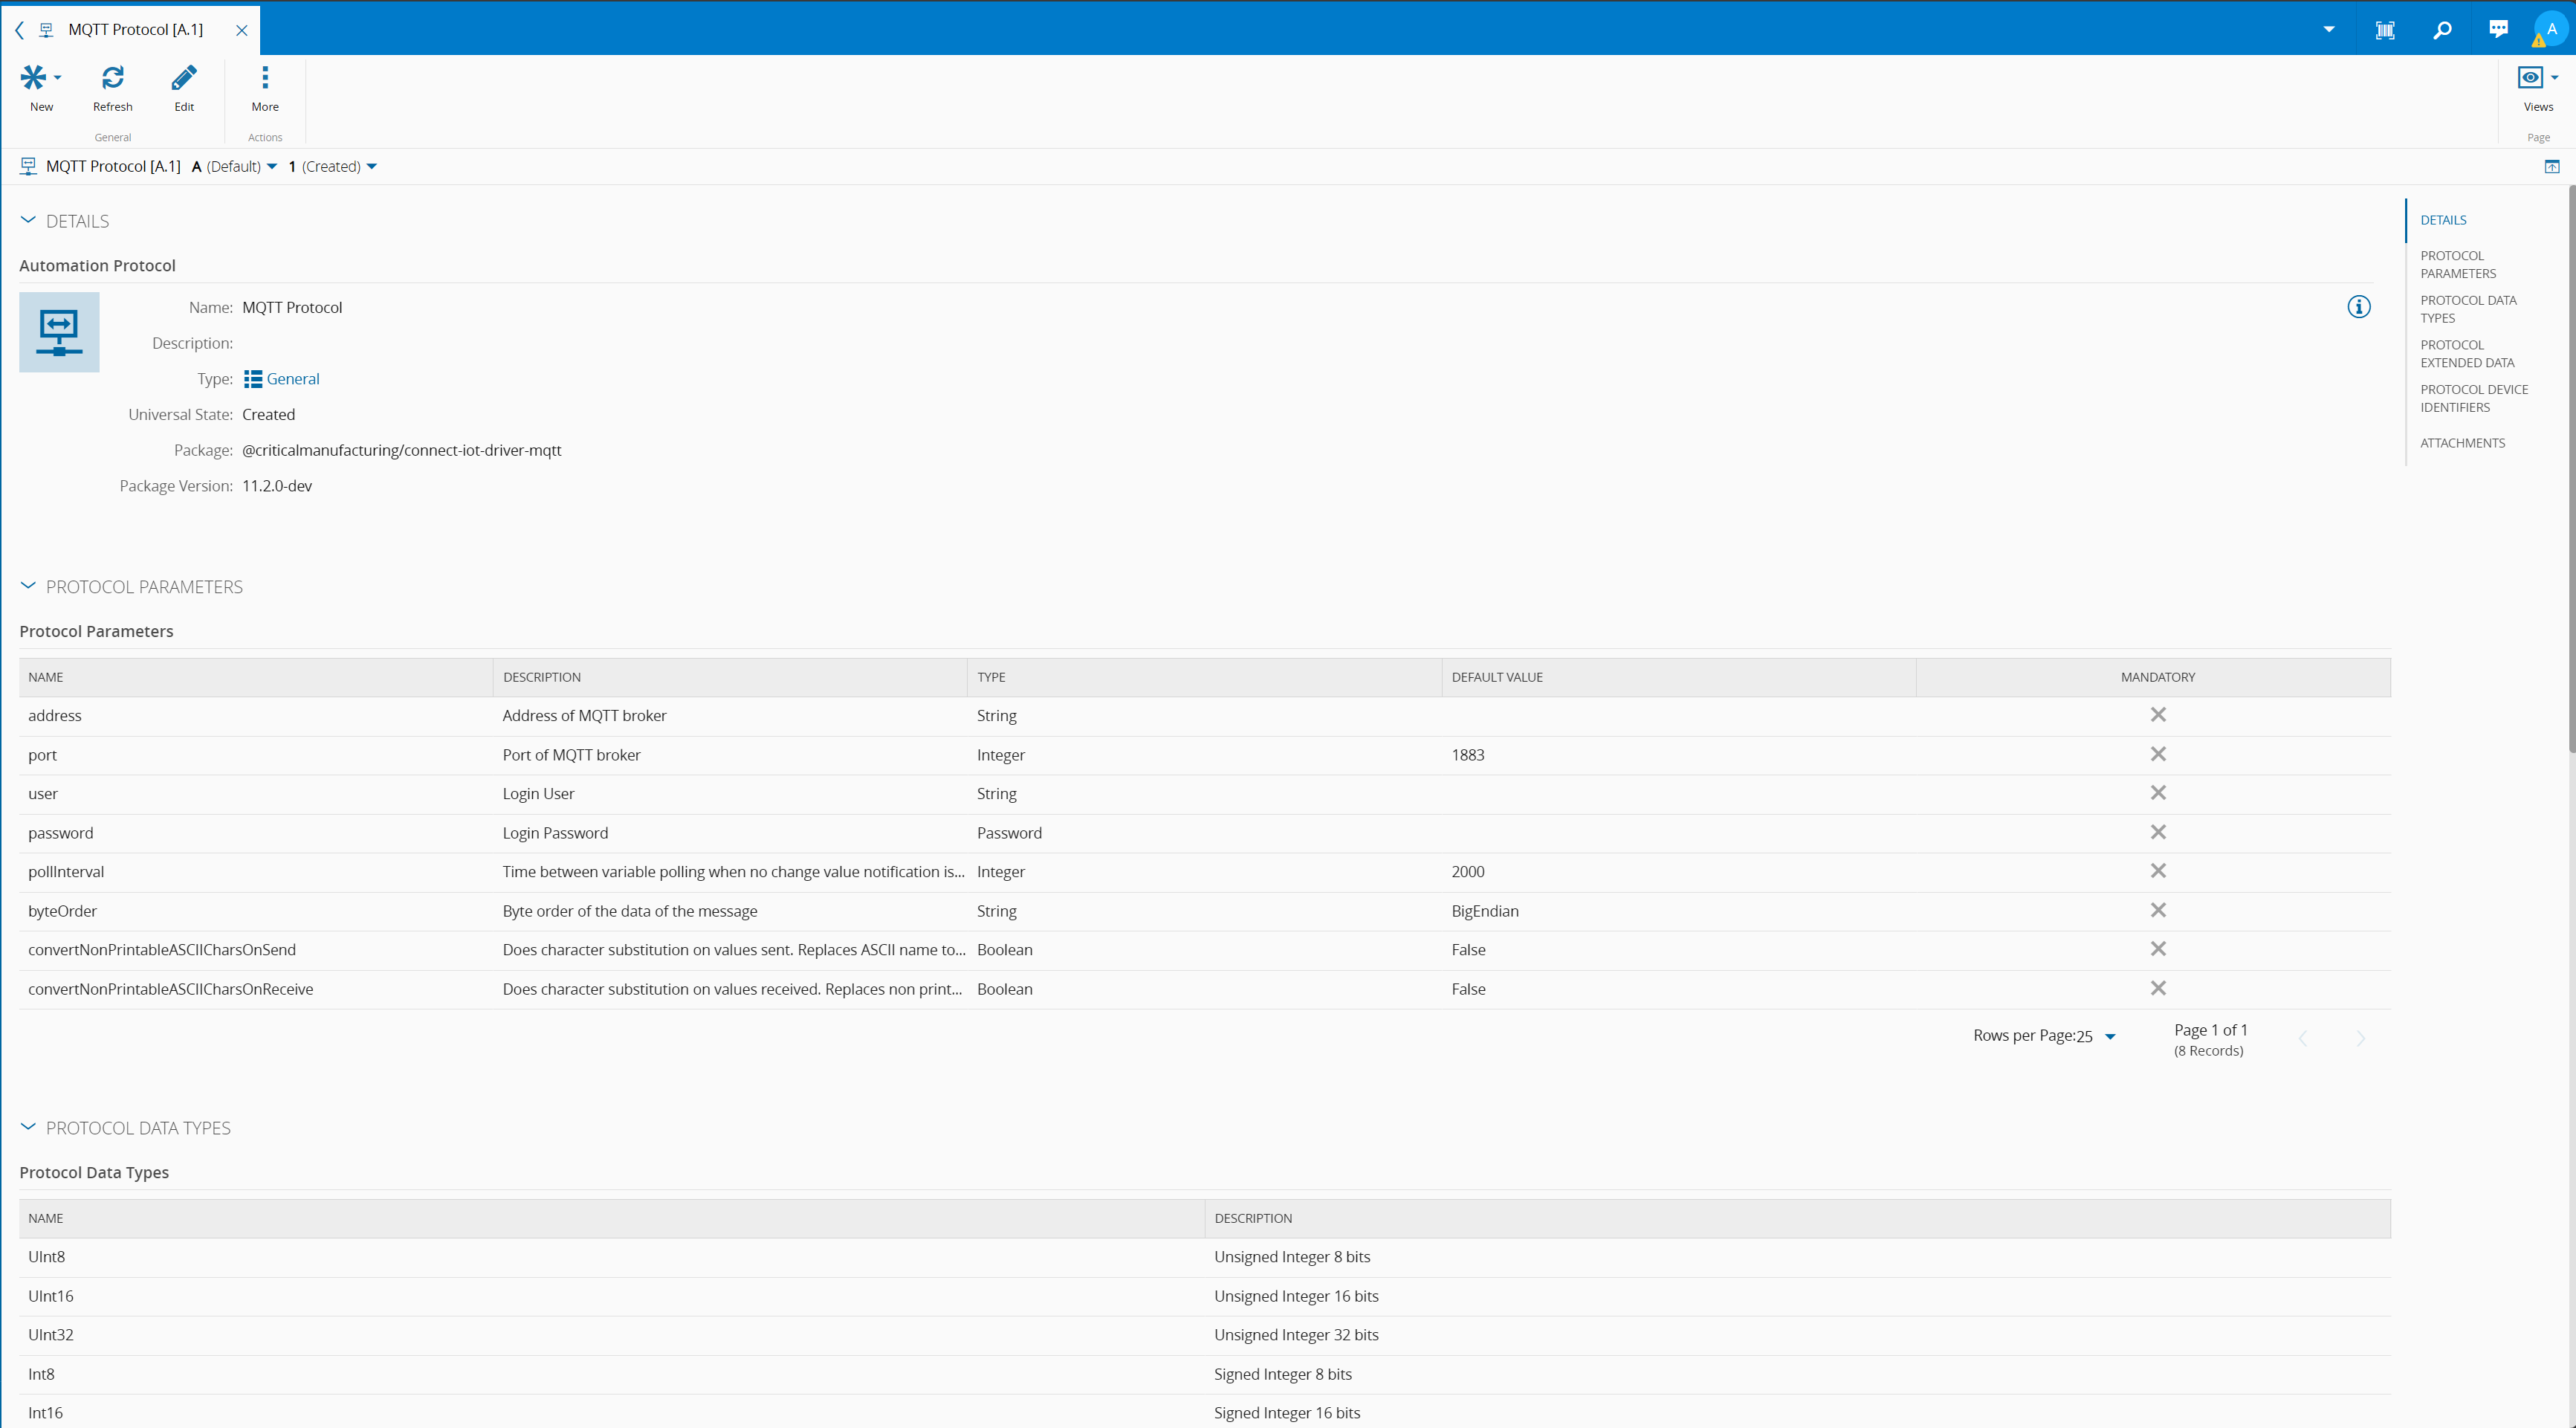
TCP-IP Automation Protocol:
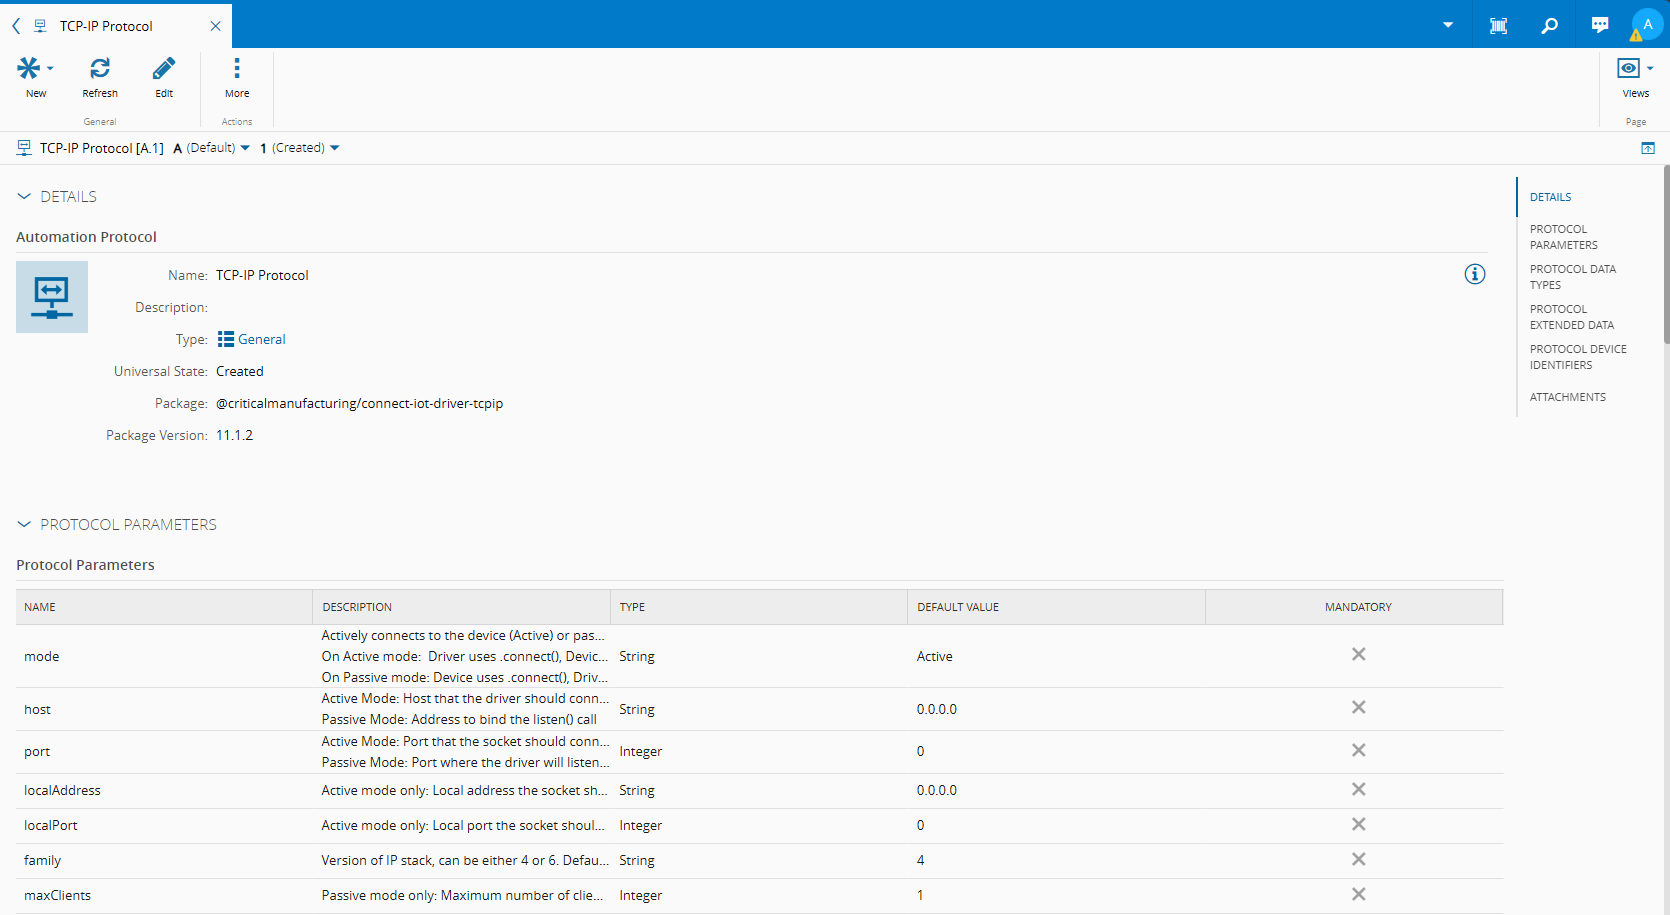
Notice that their settings are completely different. This is normal as each transport protocol has its own specificities. In Connect IoT, when creating a driver, you can specify all the settings that are particular to your driver.
Create an Automation Driver Definition MQTT#
The Automation Driver Definition will be where we map the relevant fields of the specification. Here is where we will configure all the events that we want to subscribe to or commands that we want to execute.
In this example, all topics have two levels i.e waferprep/temperature/ or waferprep/humidity/, the second level temperature or humidity is what will inform the system if this value is for temperature or humidity.
Connect IoT can serve as middleware to map everything into a common standard.The MQTT driver in Connect IoT supports wildcards:
- ‘#’ - can be used as a wildcard for all remaining levels of hierarchy. This means that it must be the final character in a subscription. For example: sensors/#
- ‘+’ - can be used as a wildcard for a single level of hierarchy. For example: sensors/+/temperature/+
I will set the Topic Name as waferprep/temperature/# for temperature and waferprep/humidity/# for humidity.
In our example, we have to create two properties and an event to surface both properties the Ambient Monitoring event:
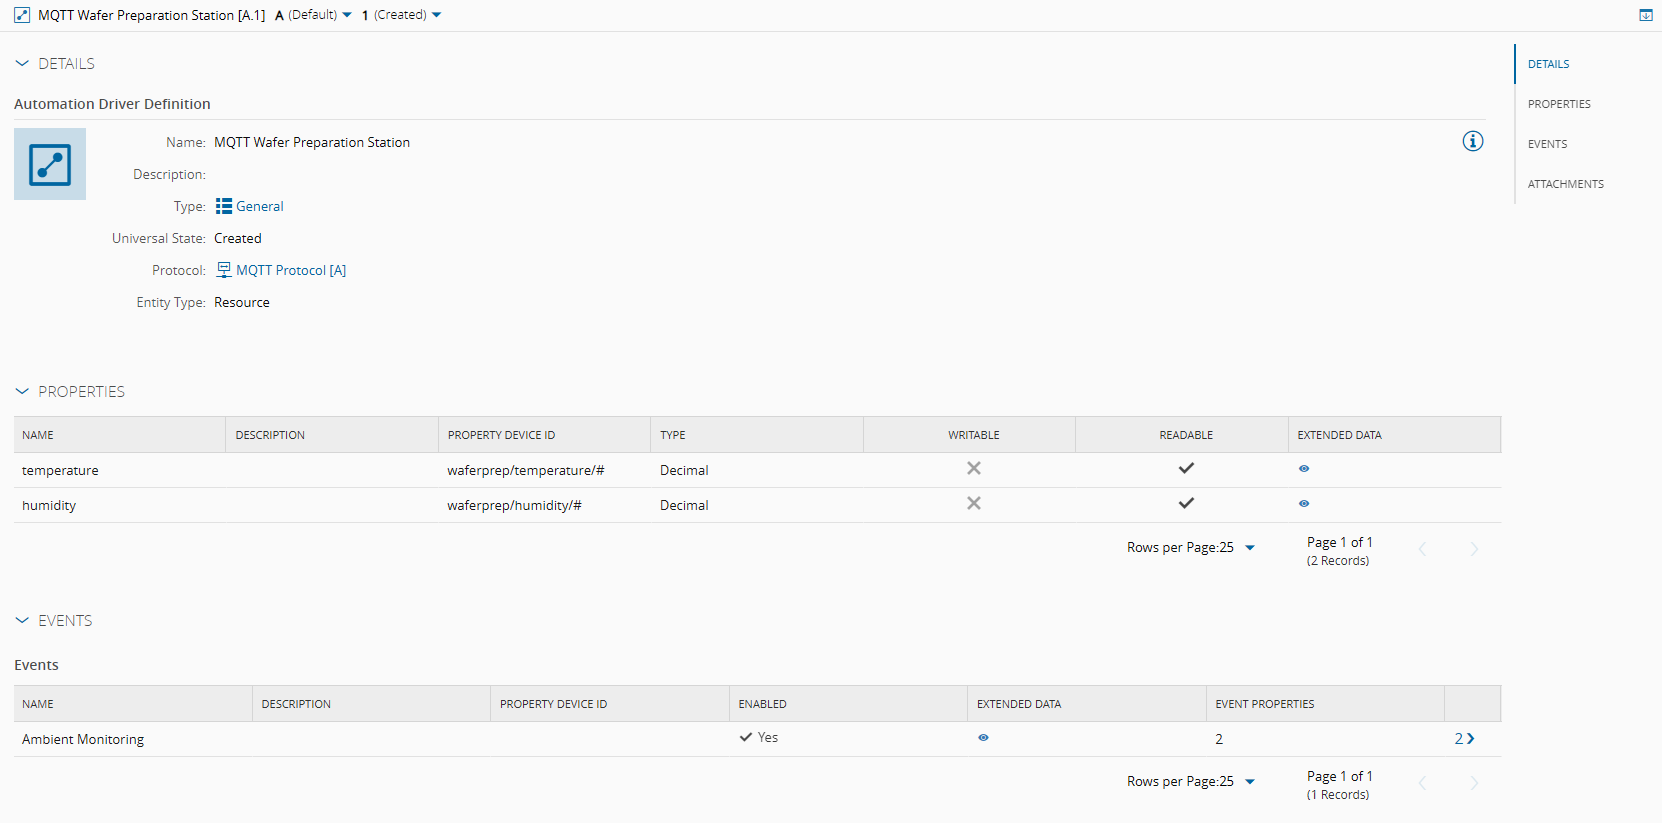
Setting the system as such will mean that whenever there is a new value for temperature or humidity the event will be triggered.
Create an Automation Driver Definition TCP-IP#
The TCP-IP driver allows for active or passive communication. In other words it can behave as a server or a client. The TCP-IP driver is a simple driver as it does not implement a standard communication interface, but it is in fact a transport protocol. It is nevertheless very useful for integrating with simple machines. Machines like barcode readers, metrology or testing is not uncommon to have simple tcp-ip interfaces.
Machine Lifecycle#
Our TCP-IP machine will host a TCP-IP Server and will send two messages.
- MaterialIn - Signals that a material has started being processed
- MaterialOut - Signals that a material has finished processing
Both these machines wait for a reply with acknowledgment, if there is no acknowledgement it will not proceed.

Message Format#
The machine messages will follow a defined format:
<STX><EventId>,Product:<Product>,Quantity:<Quantity>,Material:<Material><ETX>
In order to build a driver definition for the TCP-IP driver, we will have to understand the message and translate the message into an event.

Let’s now define what makes each member unique:
- EventId - Beginning of the message and a ‘,’
- Product - Between a token Product: and a ‘,’
- Quantity - Between a token Quantity: and a ‘,’
- Material - Between a token Material: and an end of message
The message acknowledge command is similar:
<STX><EventId>,<Material><ETX>
Mapping to a Driver Definition - Event#
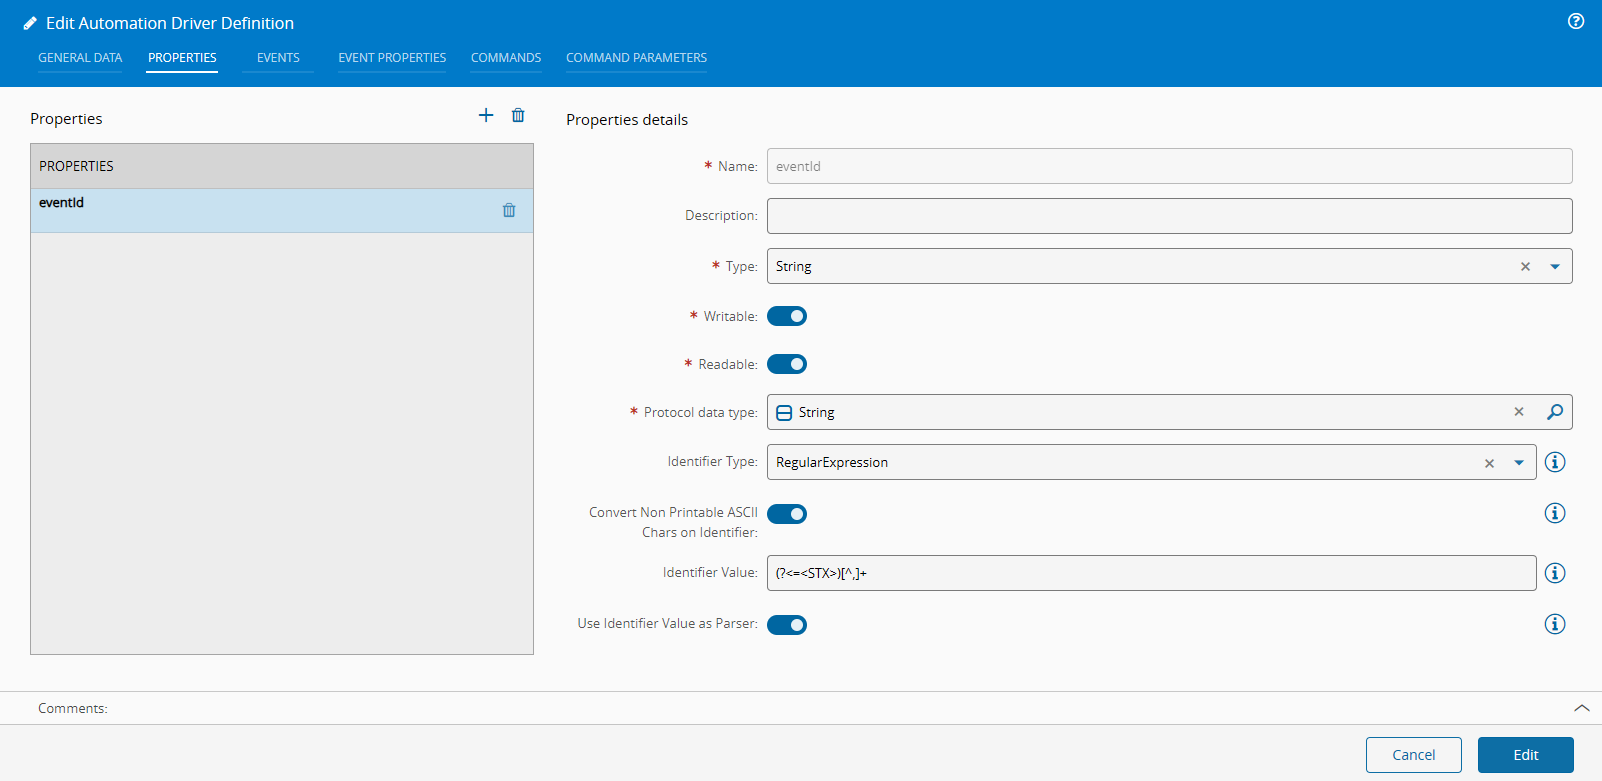
Let’s define our properties, we will use regular expressions to extract from the stream all the values that are relevant for us.
- EventId - Beginning of the message and a ‘,’
- Product - Between a token Product: and a ‘,’ (others are similar)
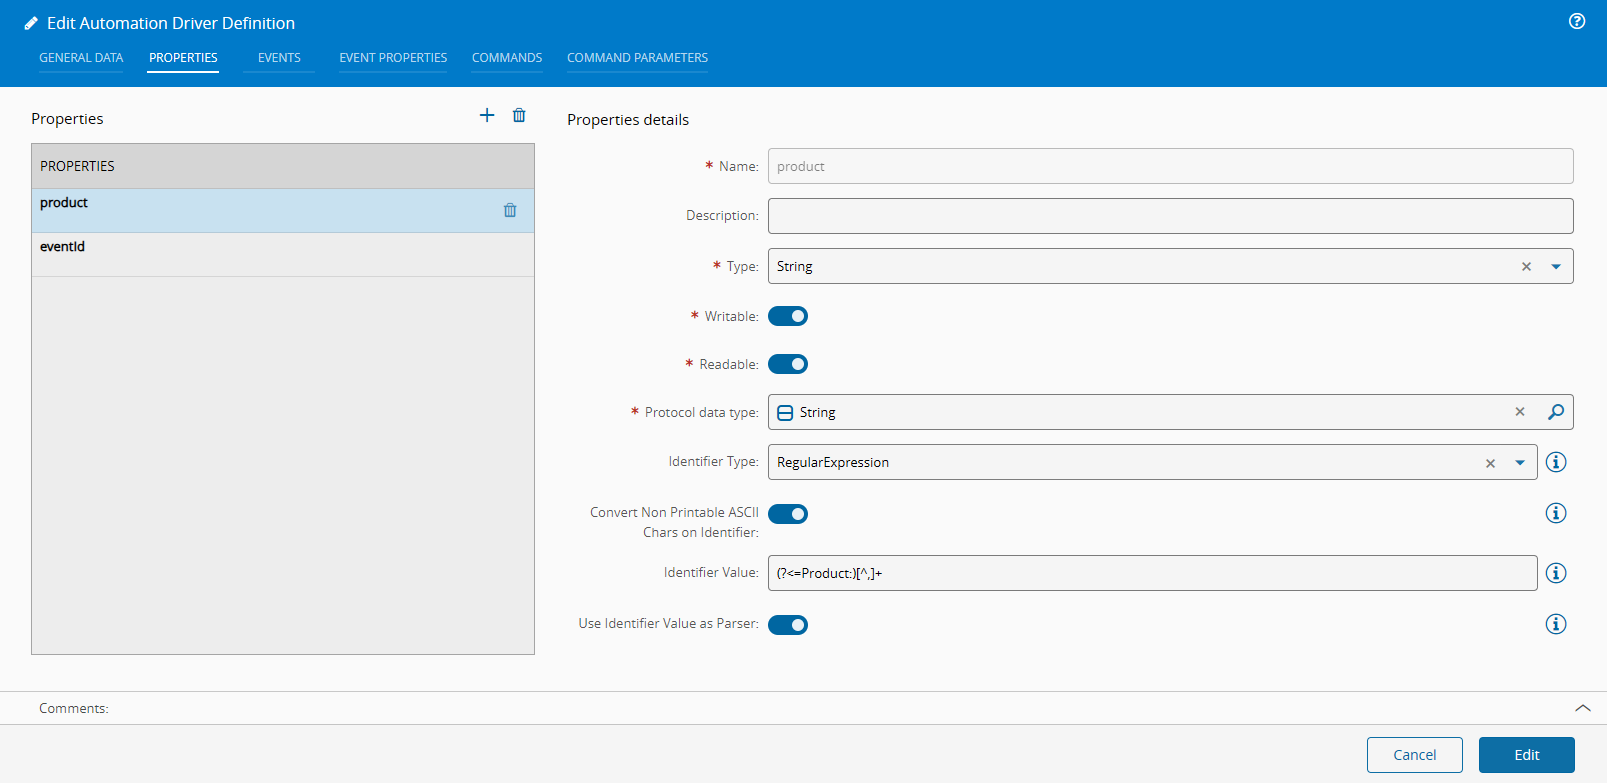
- Material - Between a token Material: and an end of message
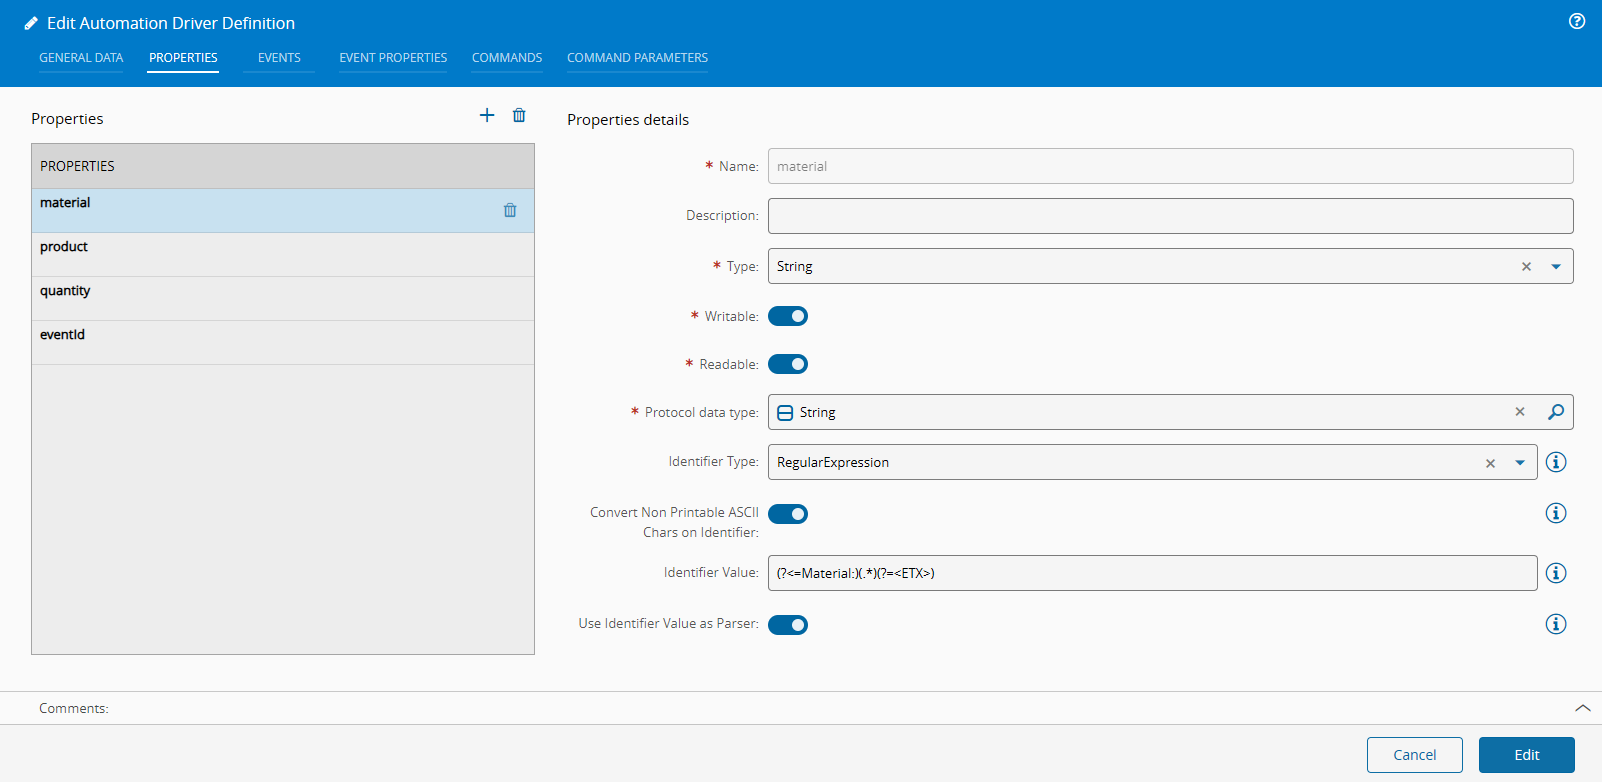
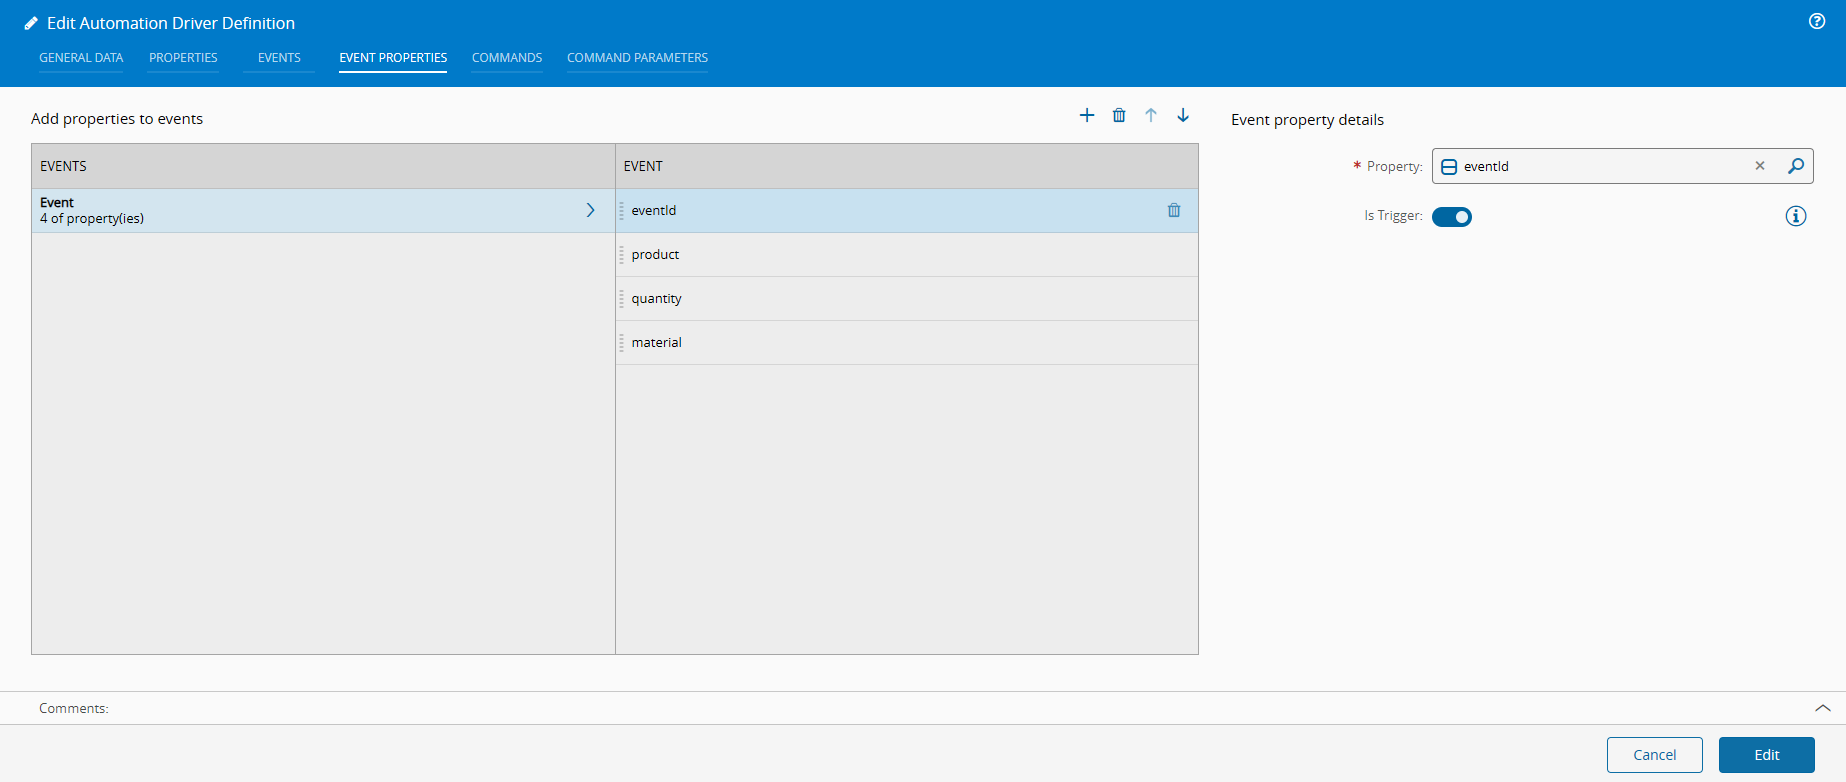
And finally, the event will tie all of this together:
Mapping to a Driver Definition - Command#
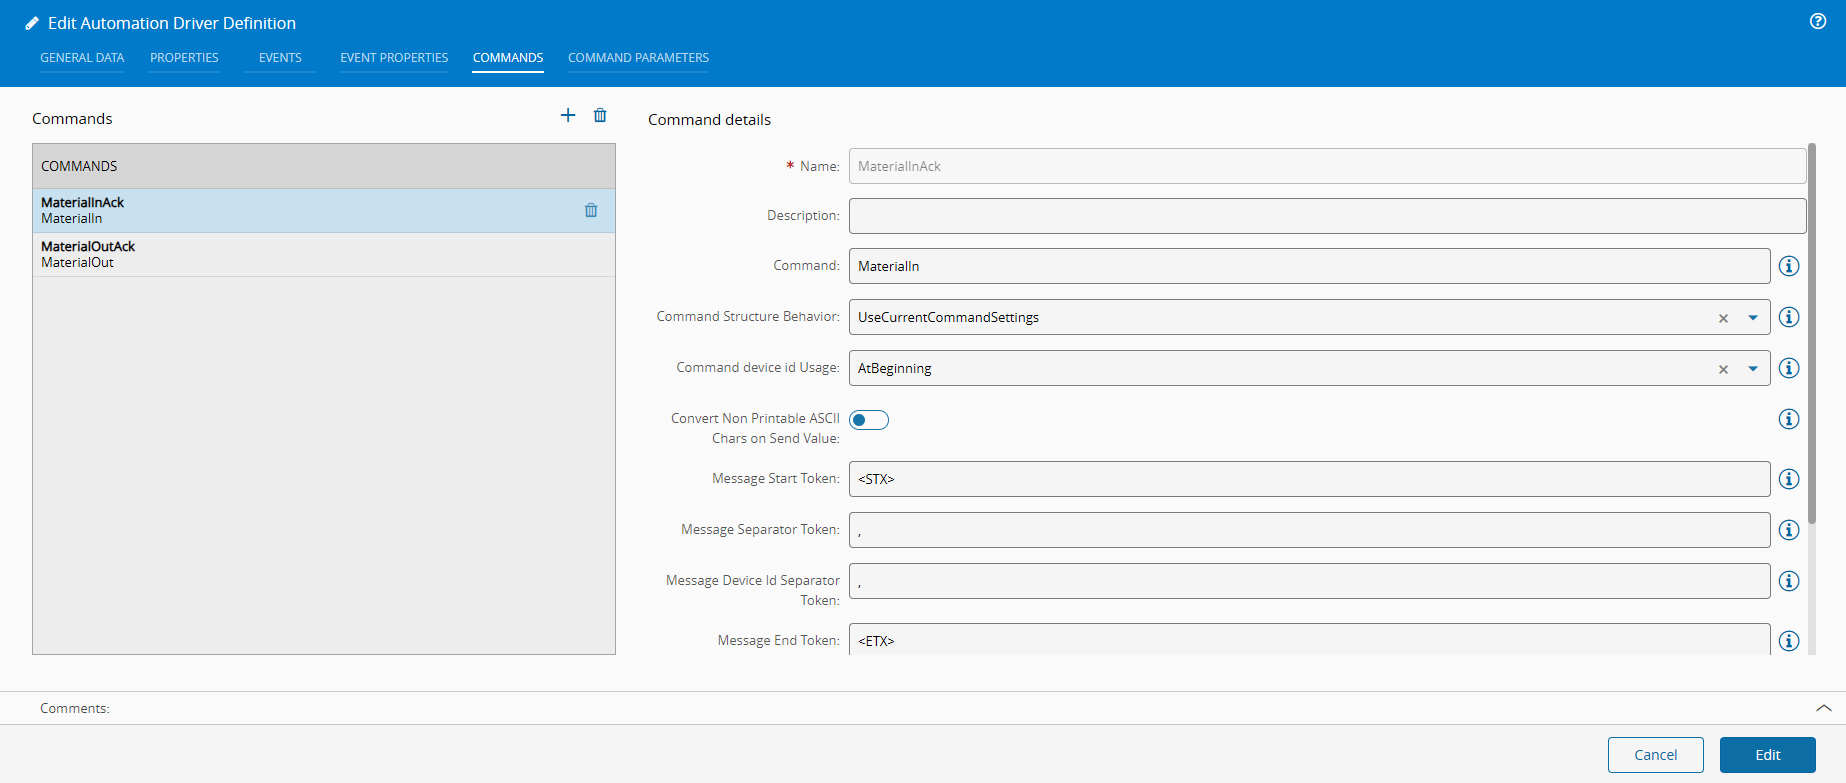
We will create two commands, one for the material in and the other for the material out. With the flag Command device id Usage as AtBeginning, the system will automatically add the device id to our command.
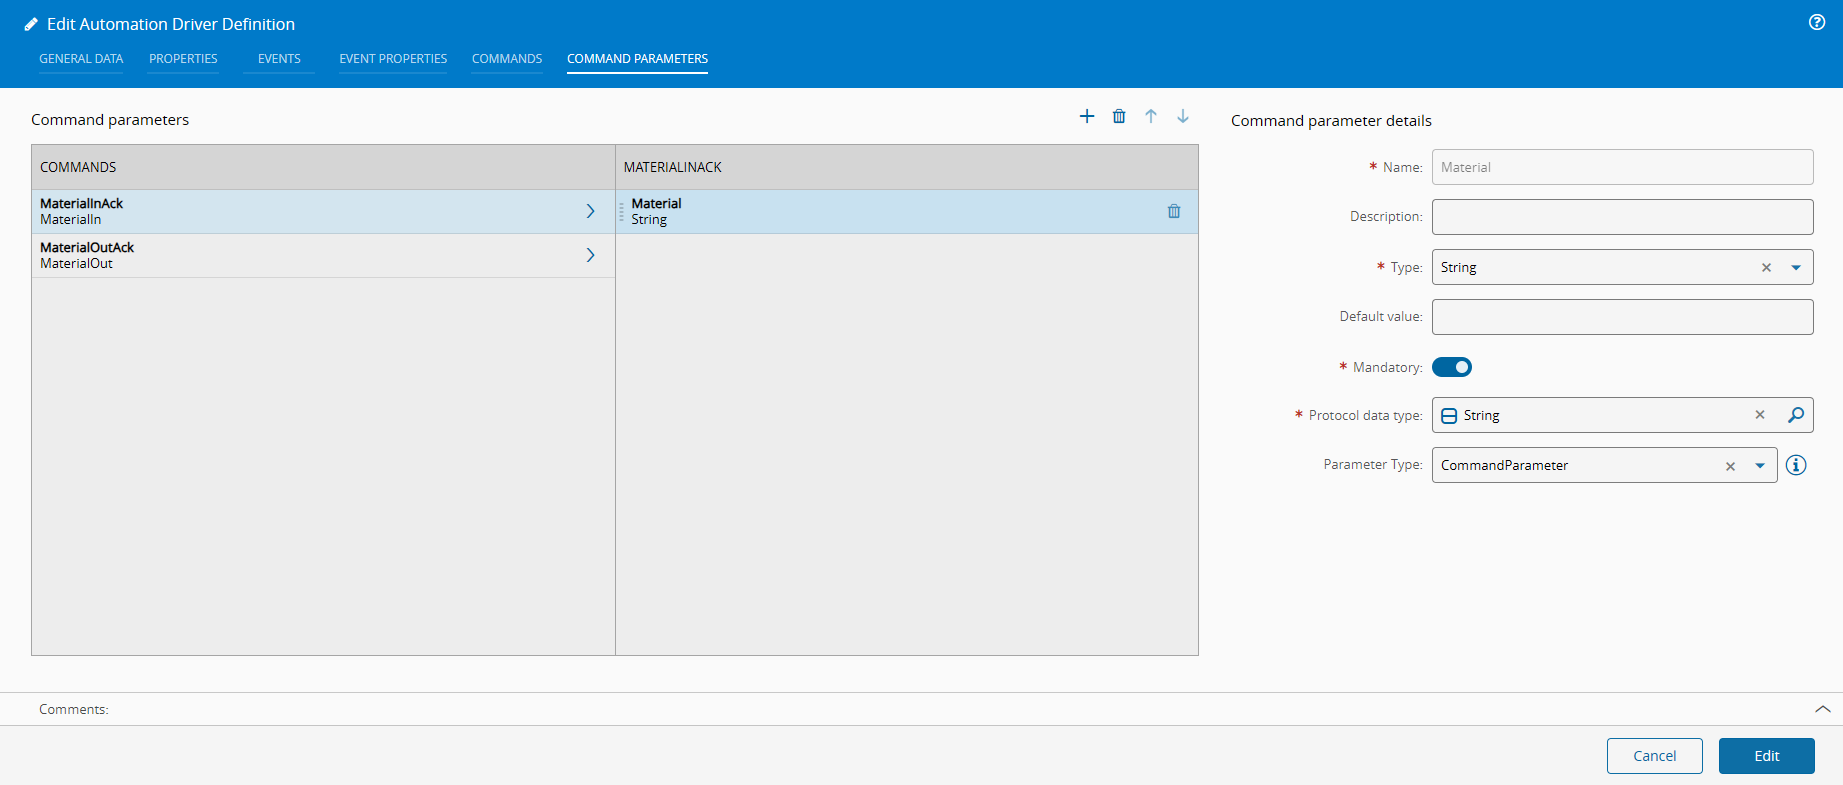
Let’s now add our material parameter:
Create an Automation Controller#
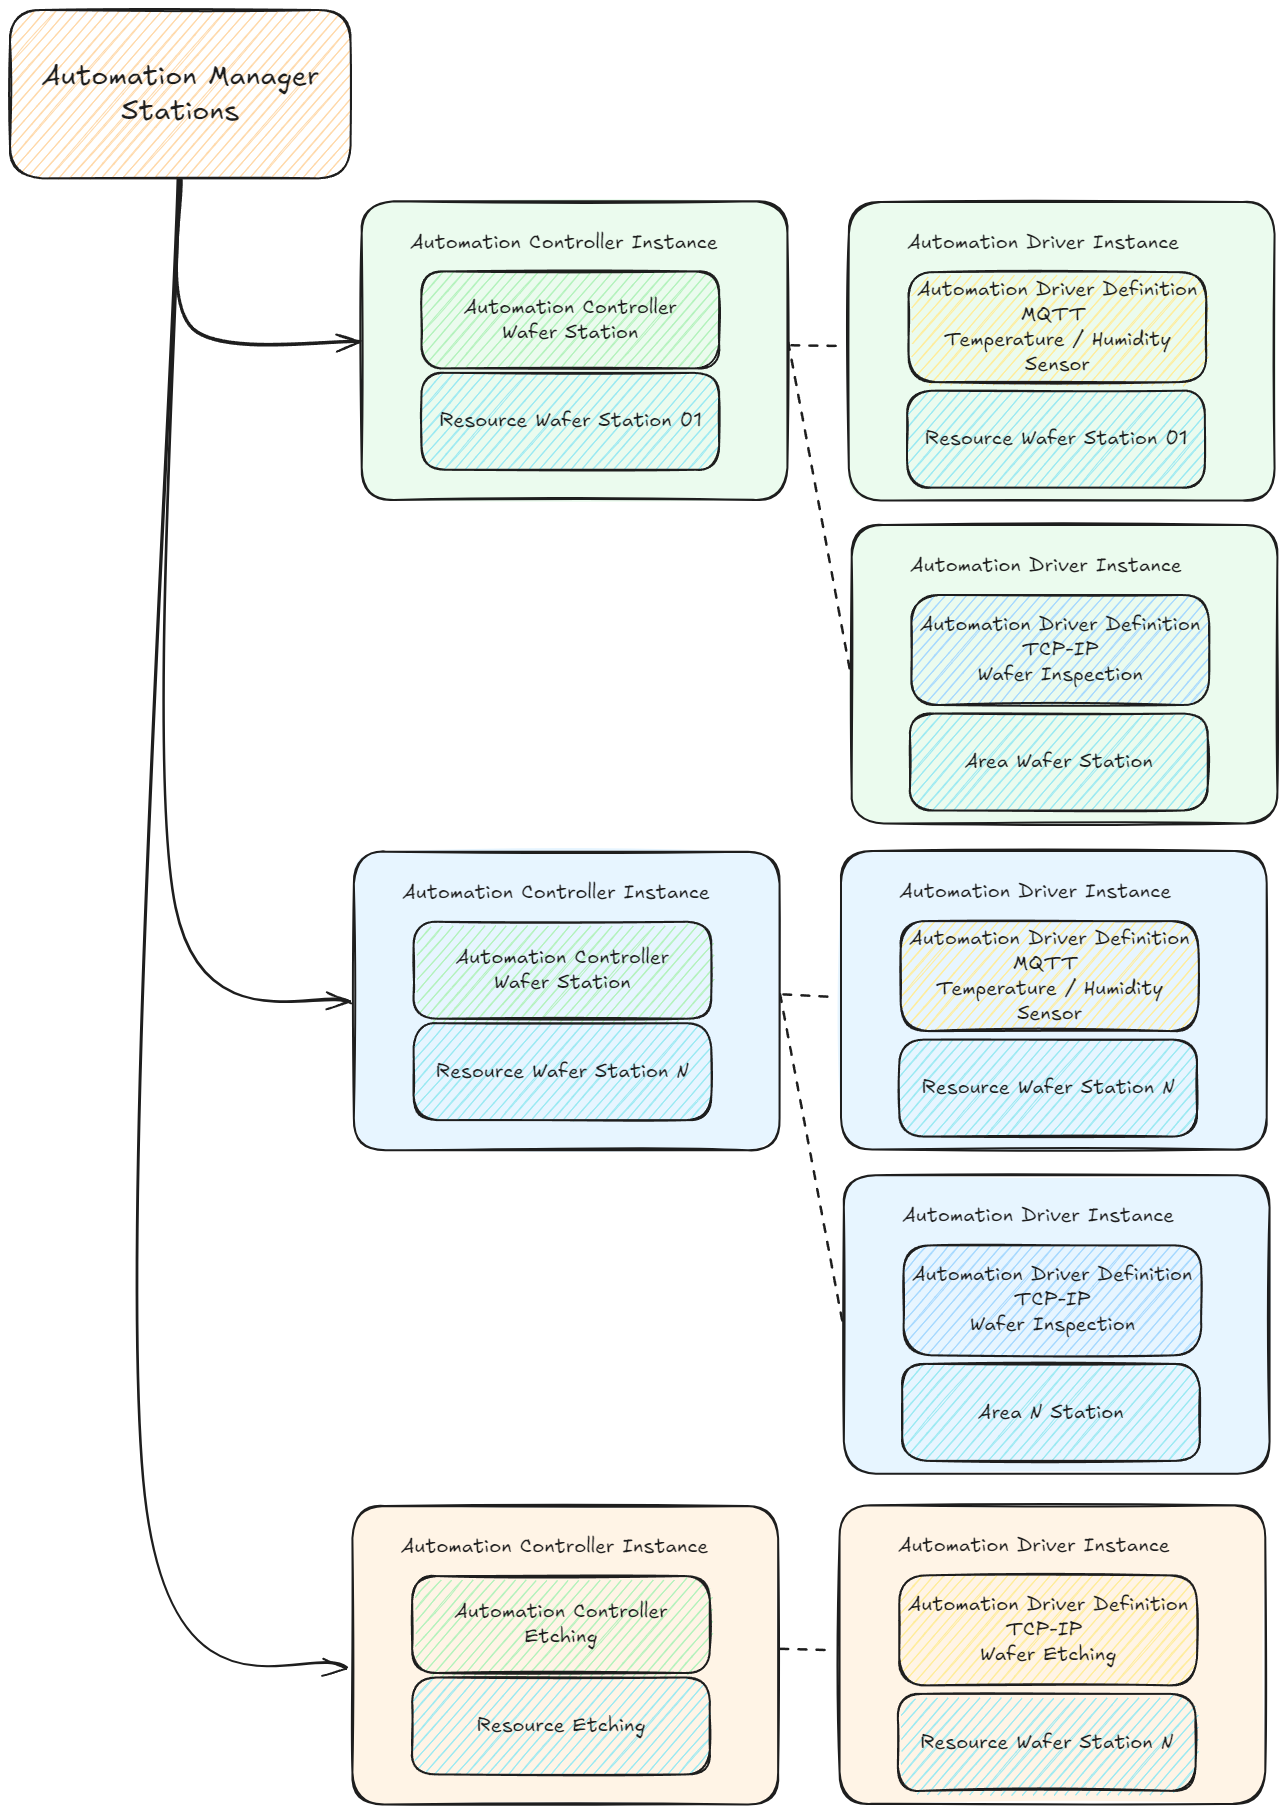
Creating our controller, we will specify that it has our two drivers, one for MQTT and one for TCP-IP.
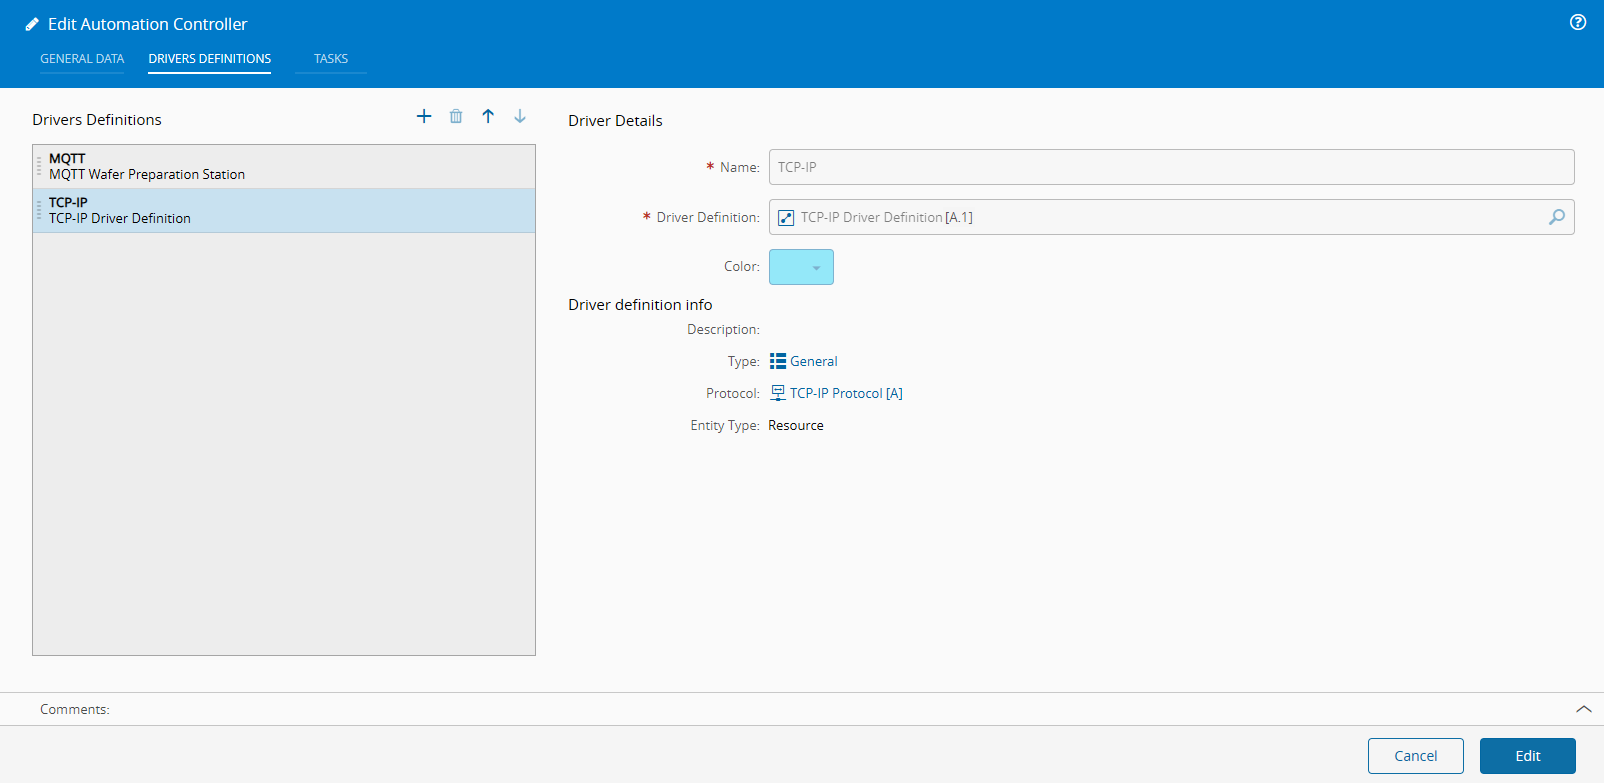
Setup#
In our setup page the template will automatically generate the two driver quickstart.

Material Handling#
The machine will provide two events, one that will signal the material in and the other will signal the material out.
For this example, we have the same event handler for both events, this is common for tcp-ip as it’s a transport protocol, for richer protocols this is less common.
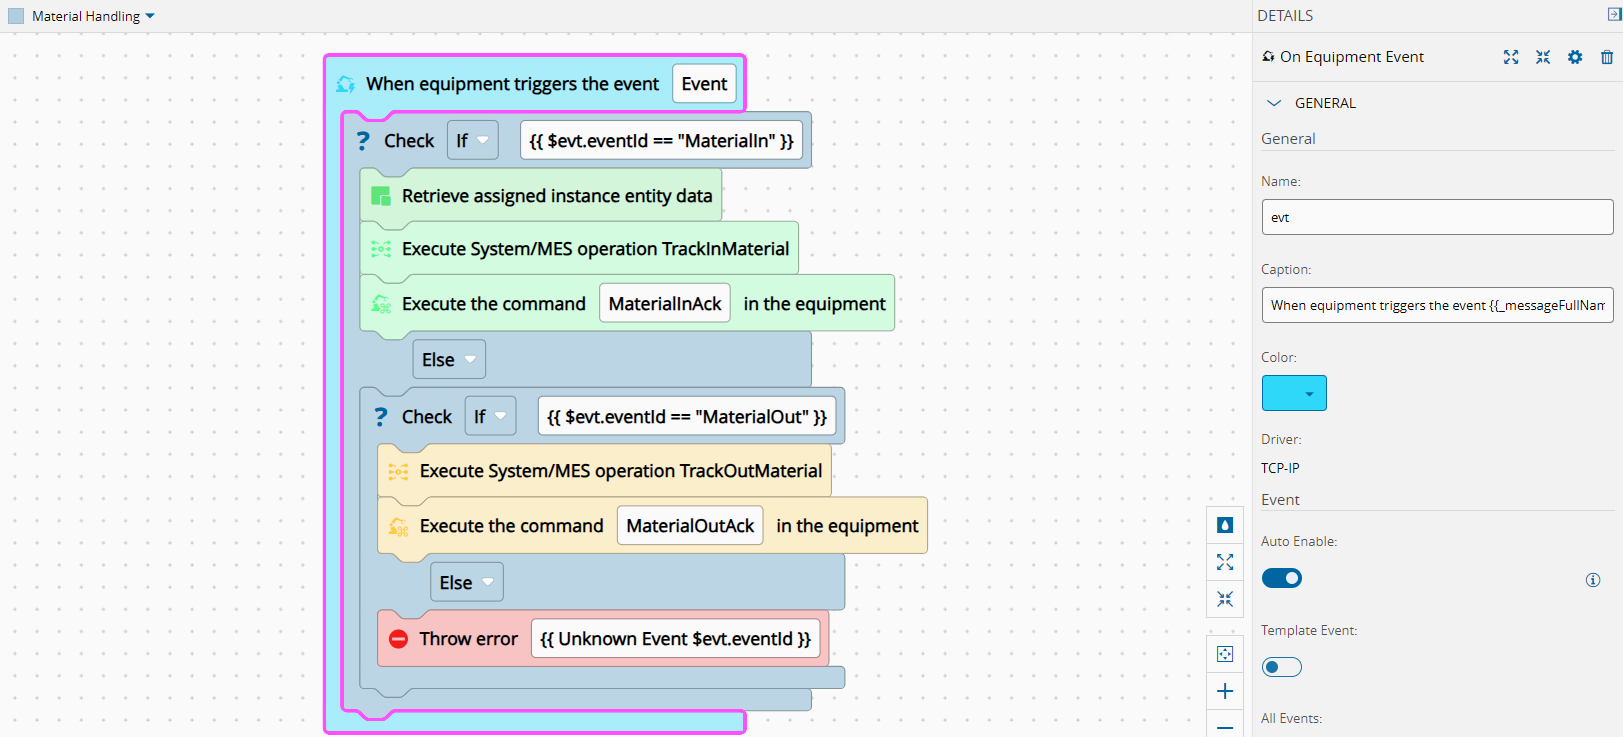
The workflow will be triggered by a TCP-IP message, with a break line. The workflow will then check the eventId against the MaterialIn or MaterialOut.
If the eventId matches the MaterialIn, we will retrieve the resource instance and call the MES service TrackInMaterial.
If the eventId matches the MaterialOut, we will simply call the MES service TrackOutMaterial.
If there is an unexpected eventId we will send an exception mentioning this is an unexpected eventId.
Control Temperature and Humidity#
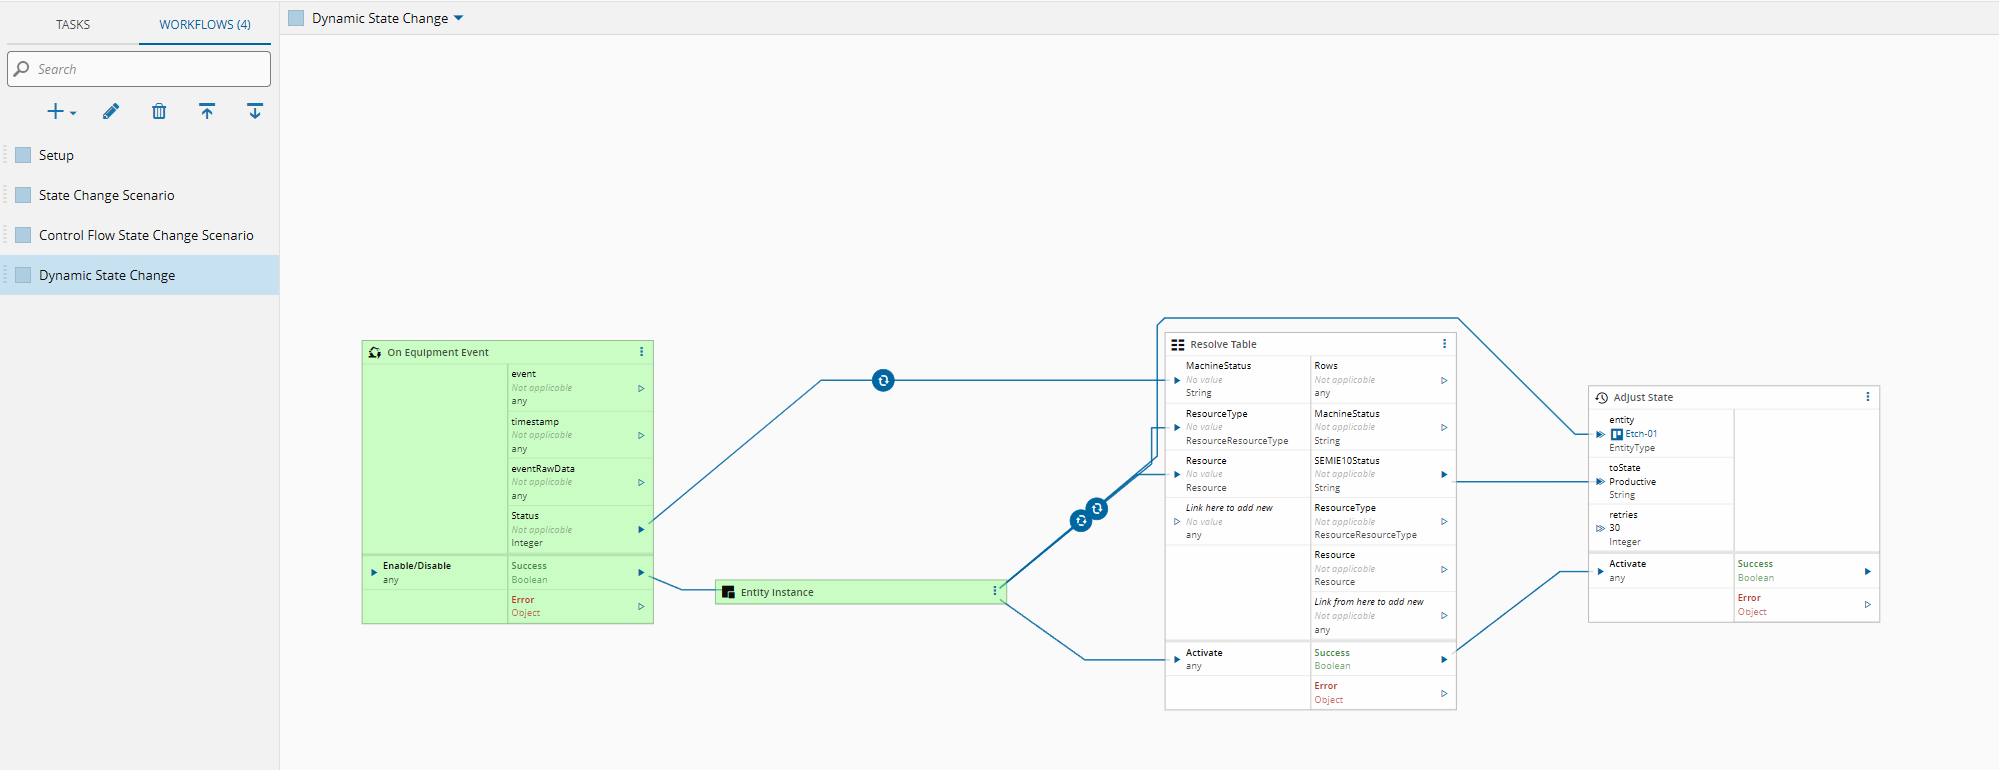
We will use an MQTT integration to receive temperature and humidity values. If the values are above a particular threshold, we will change the current resource state to a state that matches an invalid state, the SEMI-E10 Unscheduled Down.
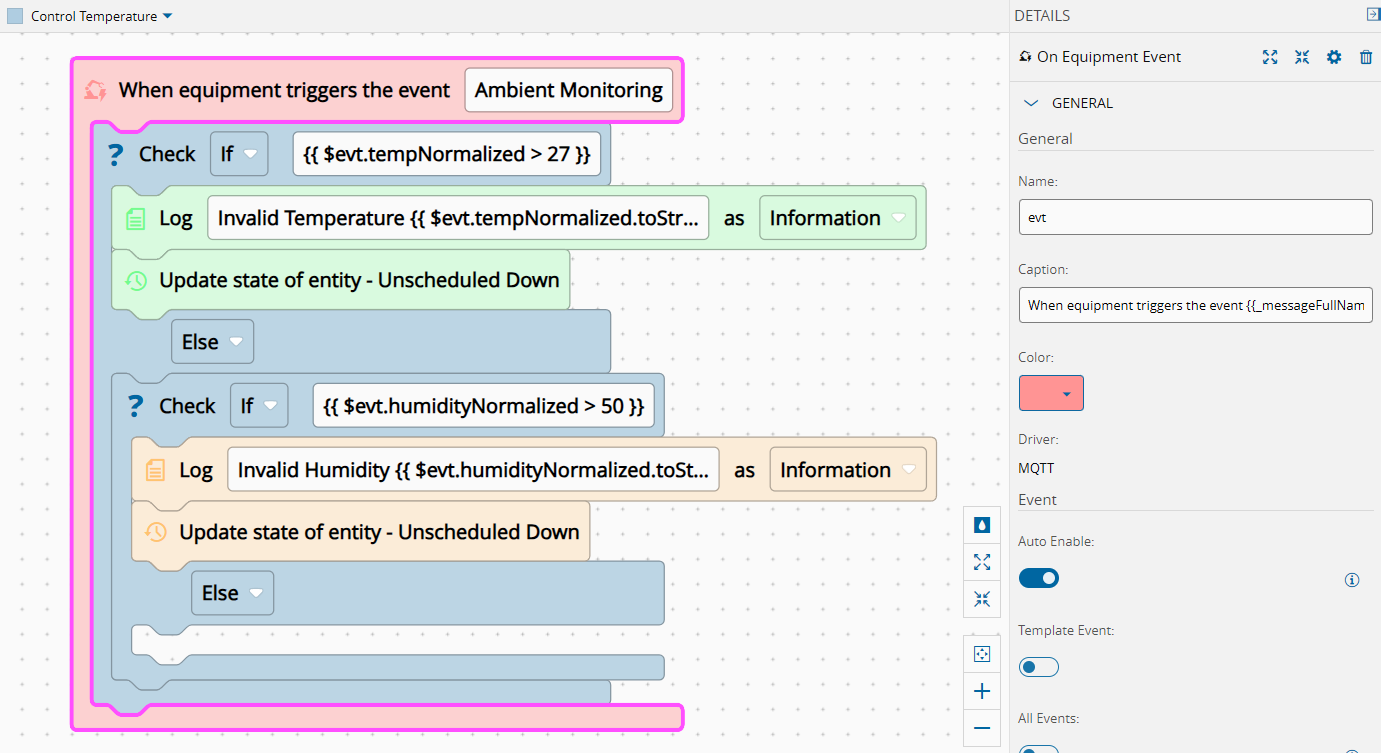
We will receive an event with temperature and humidity. If there´s no value yet defined for one the fields, they would be undefined therefore we normalize them to 0.
In the controller we will have two relevant conditions. If the temperature is above 27ºC or if the humidity is above 50% it will change the Resource state to Unscheduled Down.
Running the Scenario#
Let’s see what we can do with this controller!!!
Automation Manager#
I connected the Controller to an Automation Manager, I am using Hercules to emulate TCP-IP Server and mosquitto to serve as an mqtt broker and to publish messages.
Let’s start with the material tracking scenario. First, let’s dispatch one of our wafer materials to our station.
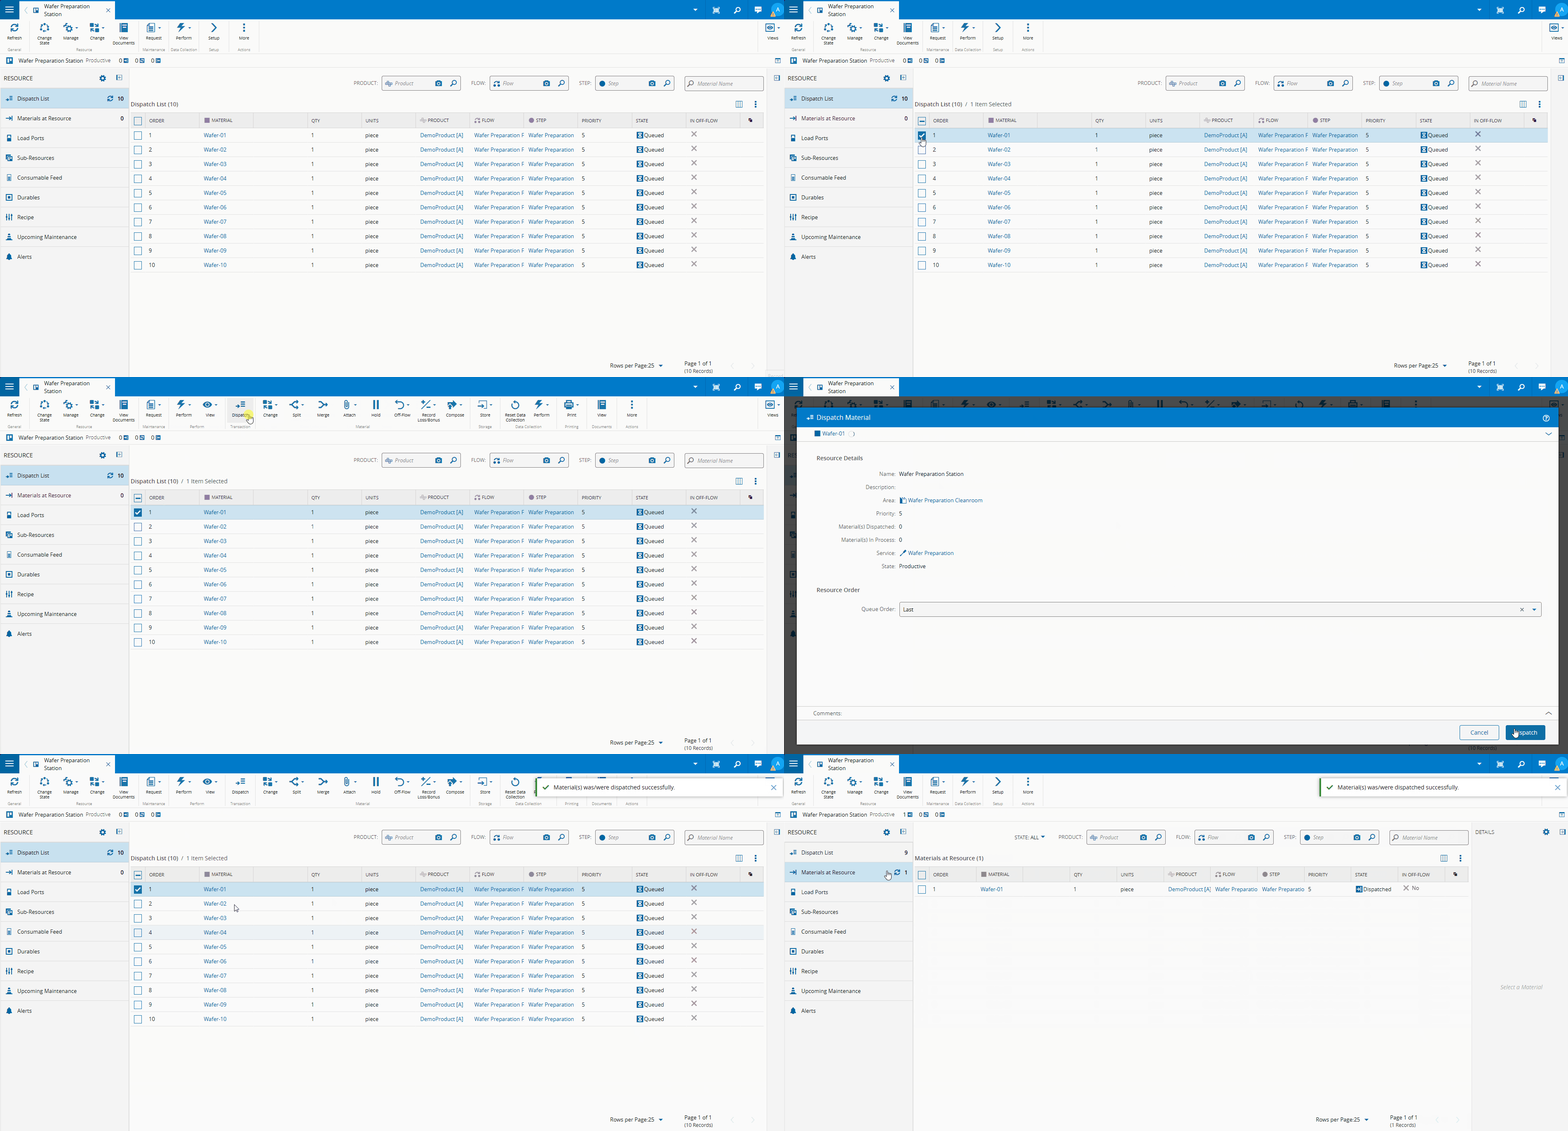
The material was at the dispatch list and was dispatched to the Wafer Preparation Station. When the material is allocated to the resource the actions possible to perform to the material are adapted to this new state.
N number of resources that could provide the same service to the material, you could dispatch to any one of them. For example, if we had a cluster of preparation stations, the material could be dispatched to any one of those stations.Material Lifecycle#
Using the TCP-IP integration let´s now perform the material production cycle.
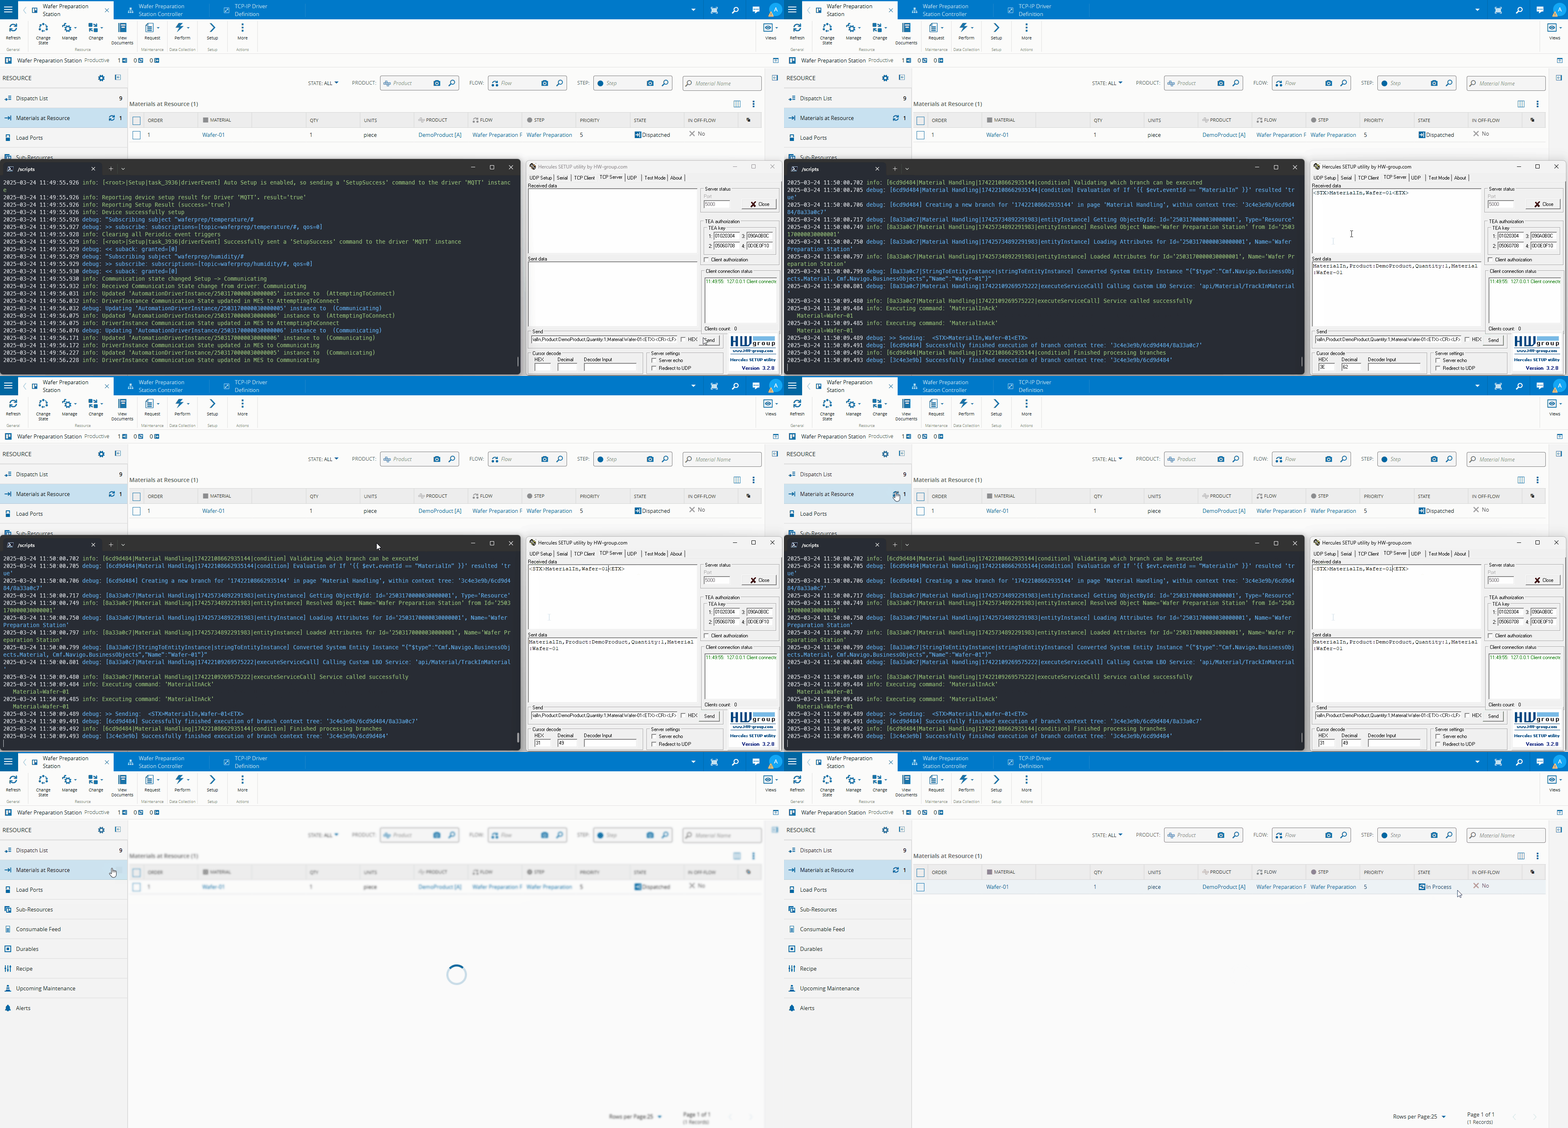
The TCP-IP simulator will send a Material In event:
<STX>MaterialIn,Product:DemoProduct,Quantity:1,Material:Wafer-01<ETX>
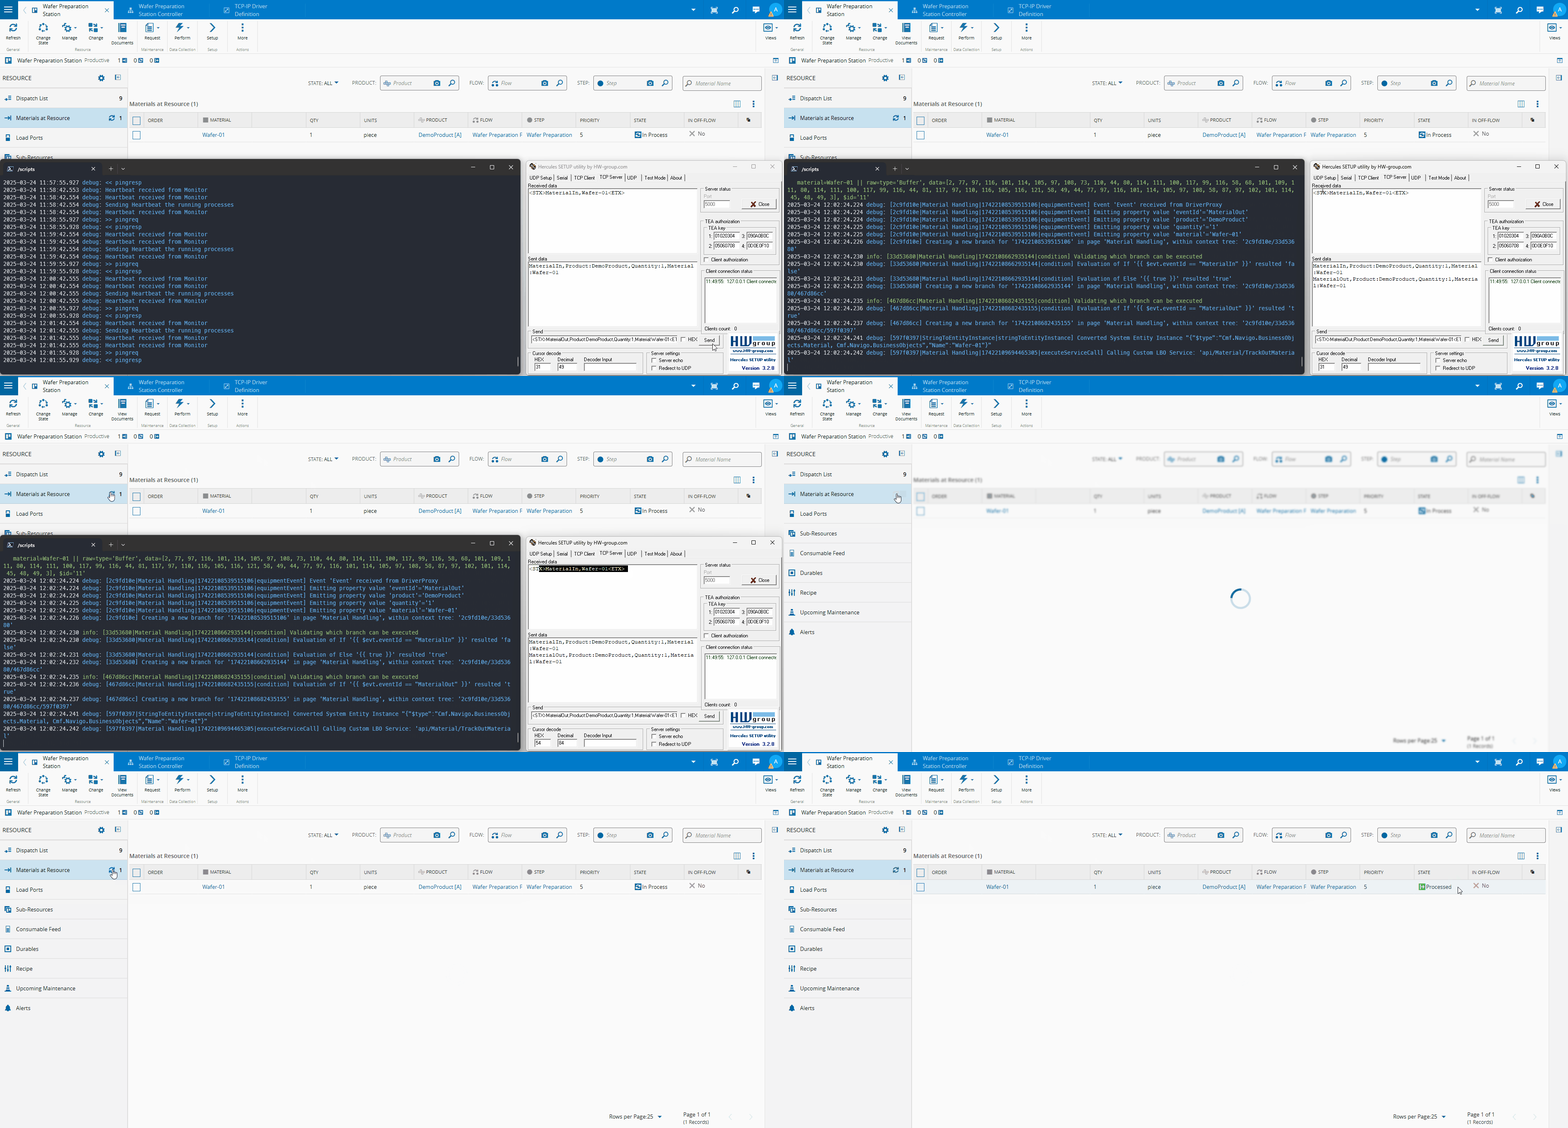
The TCP-IP simulator will send a Material Out event:
Material Lifecycle - Logging Files#
When we saw this scenario, we saw it through the lens of a console application logging. The log transports for Connect IoT are defined in the Automation Manager Configurations.
There are three major types of logging transports
- Console - for development purposes
- File - normally used to persist logs to an external network drive
- OTLP - which is the open telemetry transport.
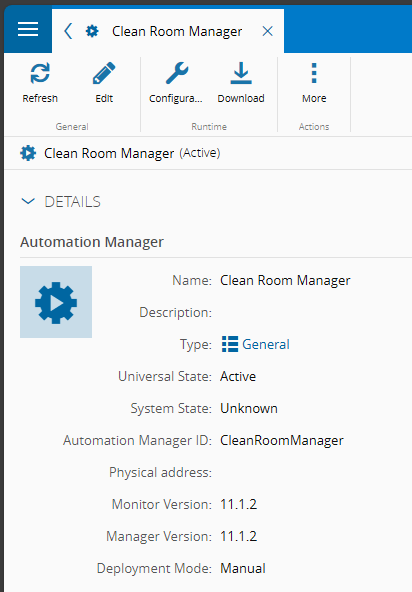
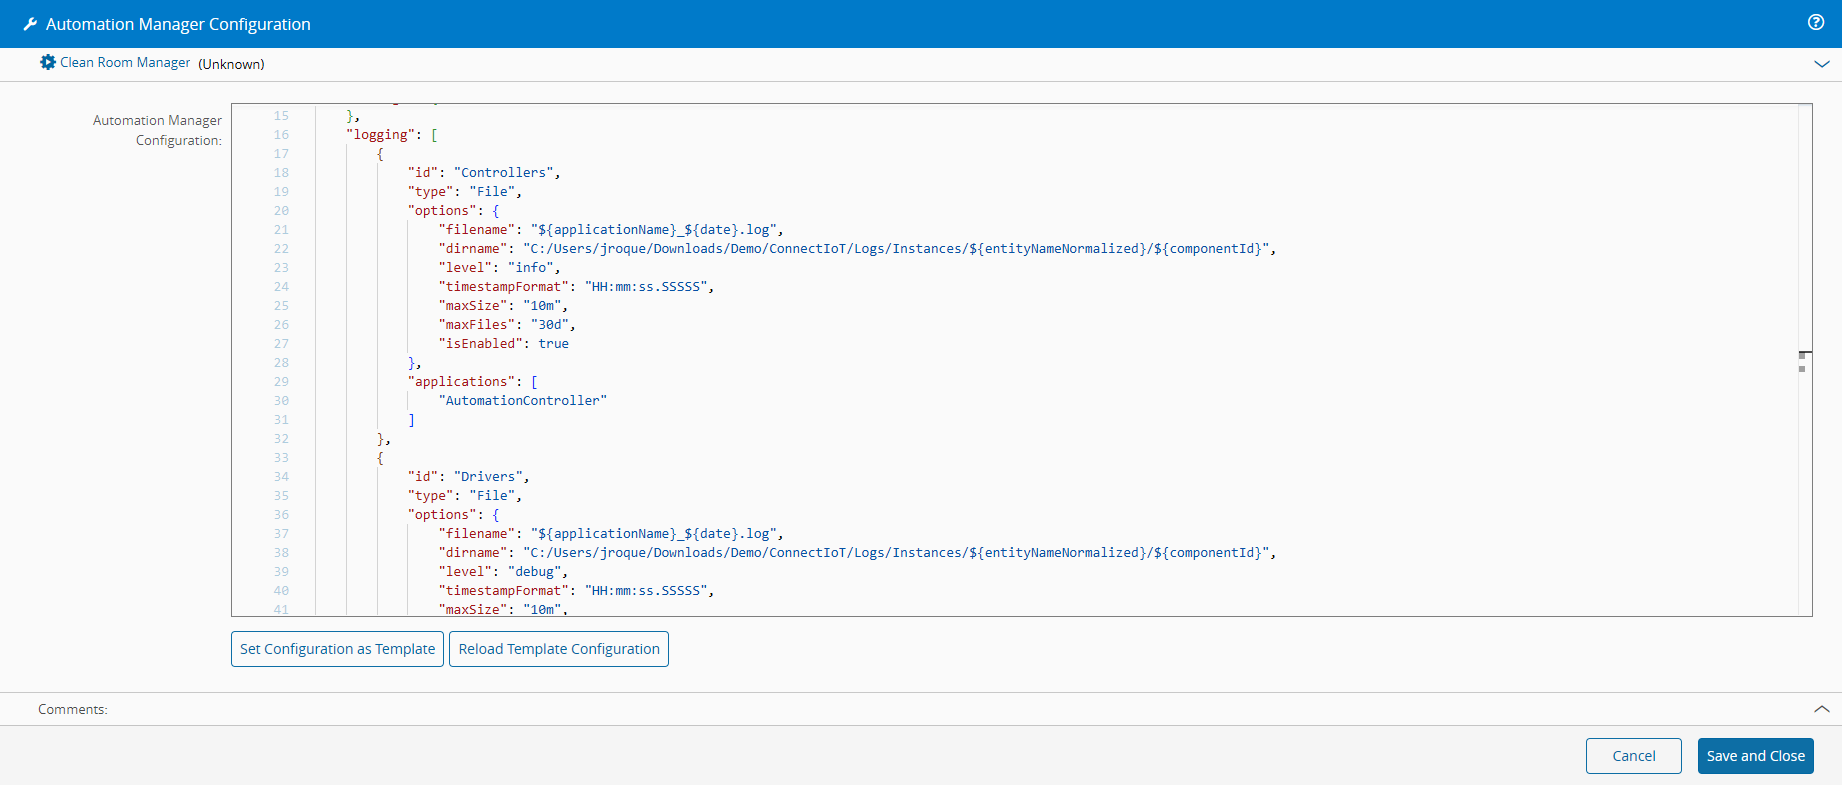
Let’s take a look at the default file transport logging configurations:
{
	"id": "Controllers",
	"type": "File",
	"options": {
		"filename": "${applicationName}_${date}.log",
		"dirname": "${temp}/ConnectIoT/Logs/Instances/${entityNameNormalized}/${componentId}",
		"level": "info",
		"timestampFormat": "HH:mm:ss.SSSSS",
		"maxSize": "10m",
		"maxFiles": "30d",
		"isEnabled": true
	},
	"applications": [
		"AutomationController"
	]
},
{
	"id": "Drivers",
	"type": "File",
	"options": {
		"filename": "${applicationName}_${date}.log",
		"dirname": "${temp}/ConnectIoT/Logs/Instances/${entityNameNormalized}/${componentId}",
		"level": "debug",
		"timestampFormat": "HH:mm:ss.SSSSS",
		"maxSize": "10m",
		"maxFiles": "30d",
		"isEnabled": true
	},
	"applications": [
		"Driver*"
	]
},
{
	"id": "ManagerAndMonitor",
	"type": "File",
	"options": {
		"filename": "${applicationName}_${date}.log",
		"dirname": "${temp}/Demo/ConnectIoT/Logs/${applicationName}/${managerId}",
		"level": "info",
		"timestampFormat": "HH:mm:ss.SSSSS",
		"maxSize": "10m",
		"maxFiles": "30d",
		"isEnabled": true
	},
	"applications": [
		"AutomationMonitor",
		"AutomationManager"
	]
}
The default configuration splits the file logging into three different transports. These will generate a folder tree structure.
One transport will log all the information related to the Controller, another will have all the information regarding Drivers and the last one refers to the manager and monitor boot up.
This configurations allow us to customize what is of interest to us to log, for example the level of verbosity and the roll over of the logs. By default, logs will be kept for 30 days and a new file is generated every 10 megabytes, all logs will have an entry with a timestamp.
Let’s take a look at the same scenario through the log files.

The Logging structure is created using the dirname and filename specified in the configuration.
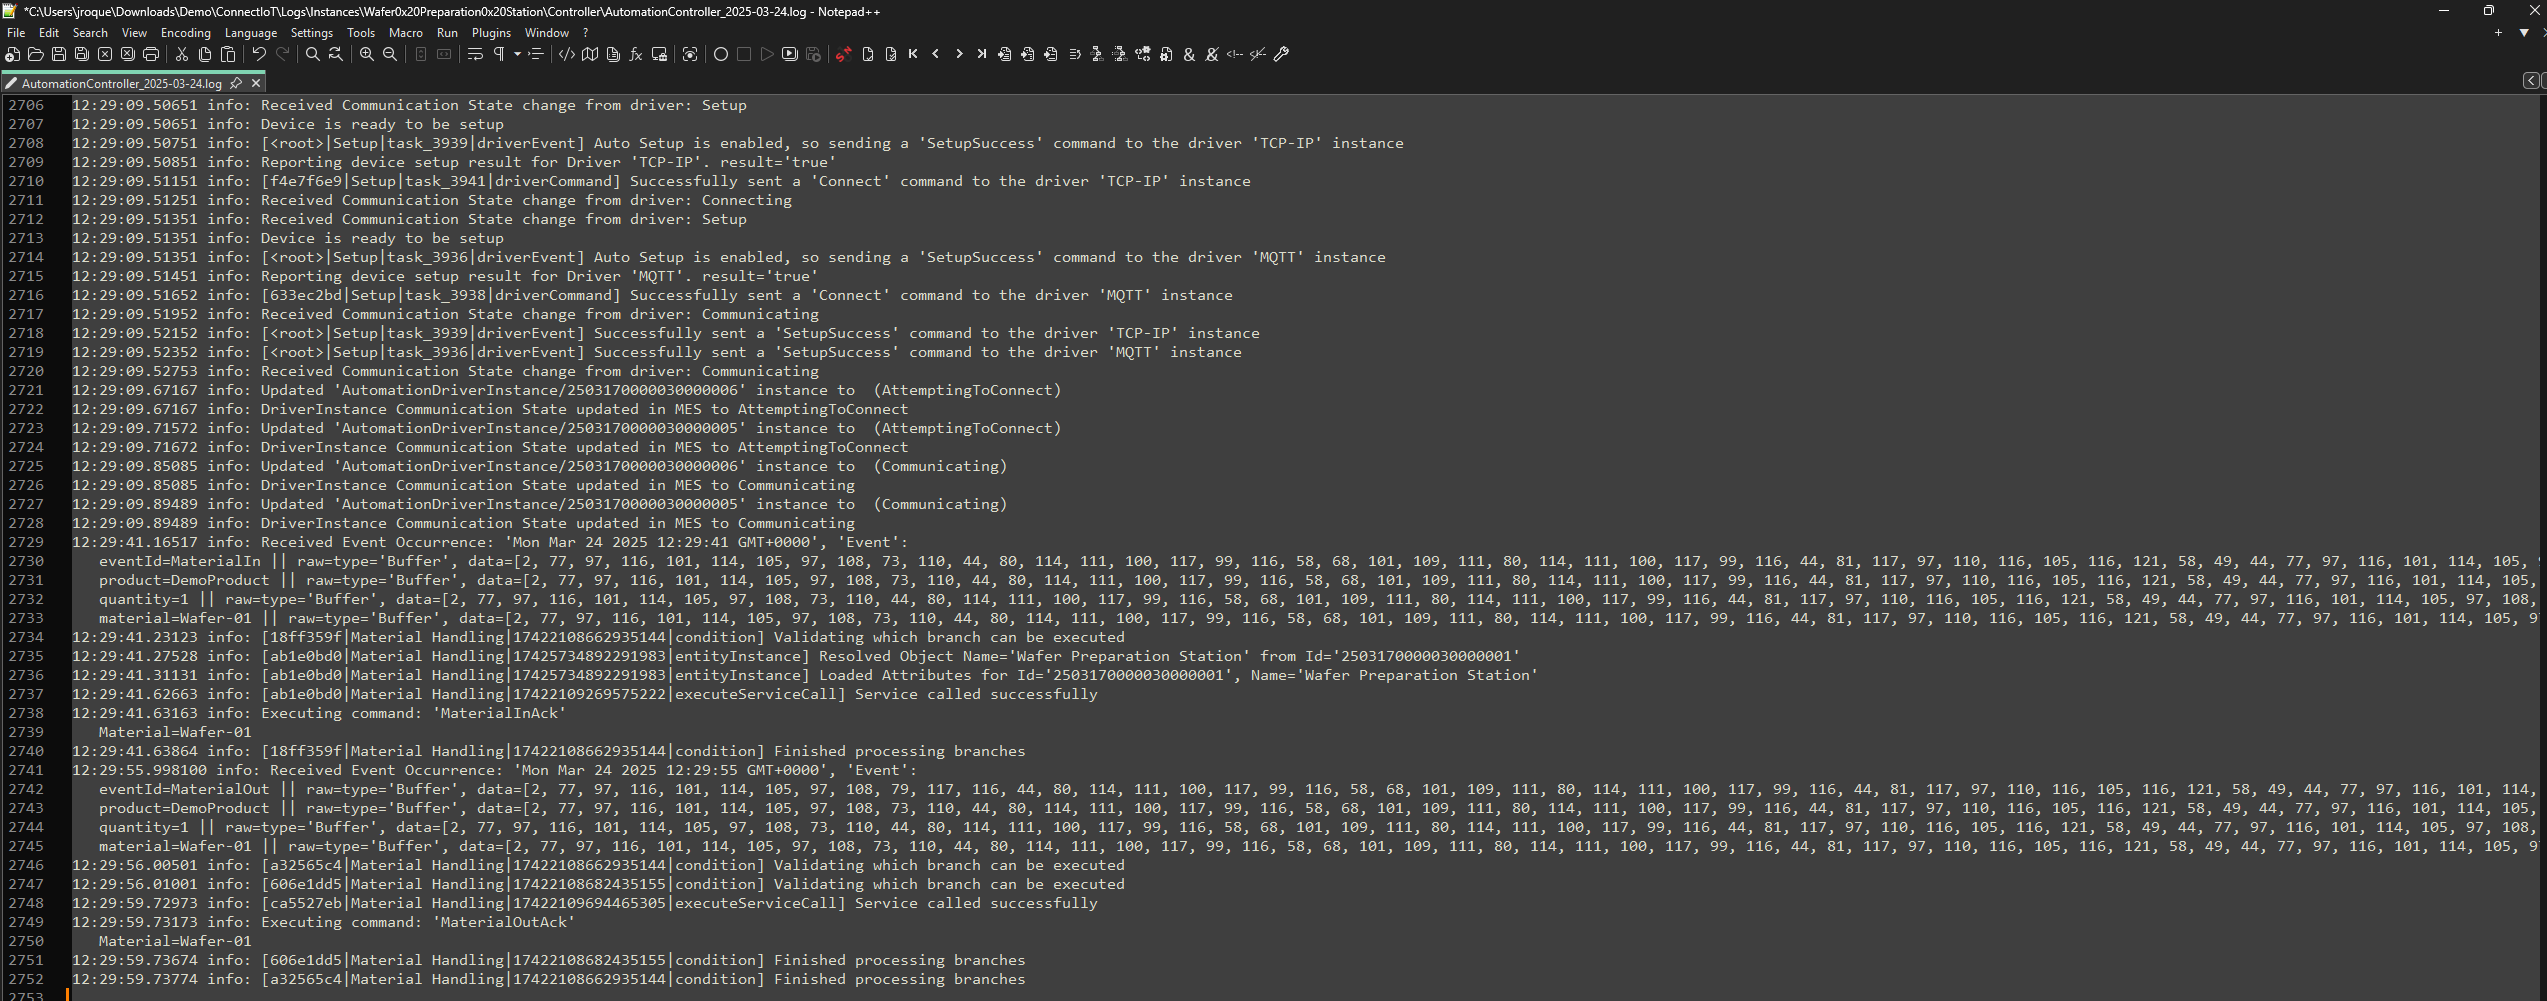
One important highlight is that you can already see when the actions occurred in the Controller layer, which tasks activated in each page and each execution will have a unique identifier. The user can then leverage all this information to backtrace all that has occurred in the system.
The logs are not as complete as the ones we saw in the console log, as the console log merges all logging so let´s take a look at the driver tcp-ip logs.

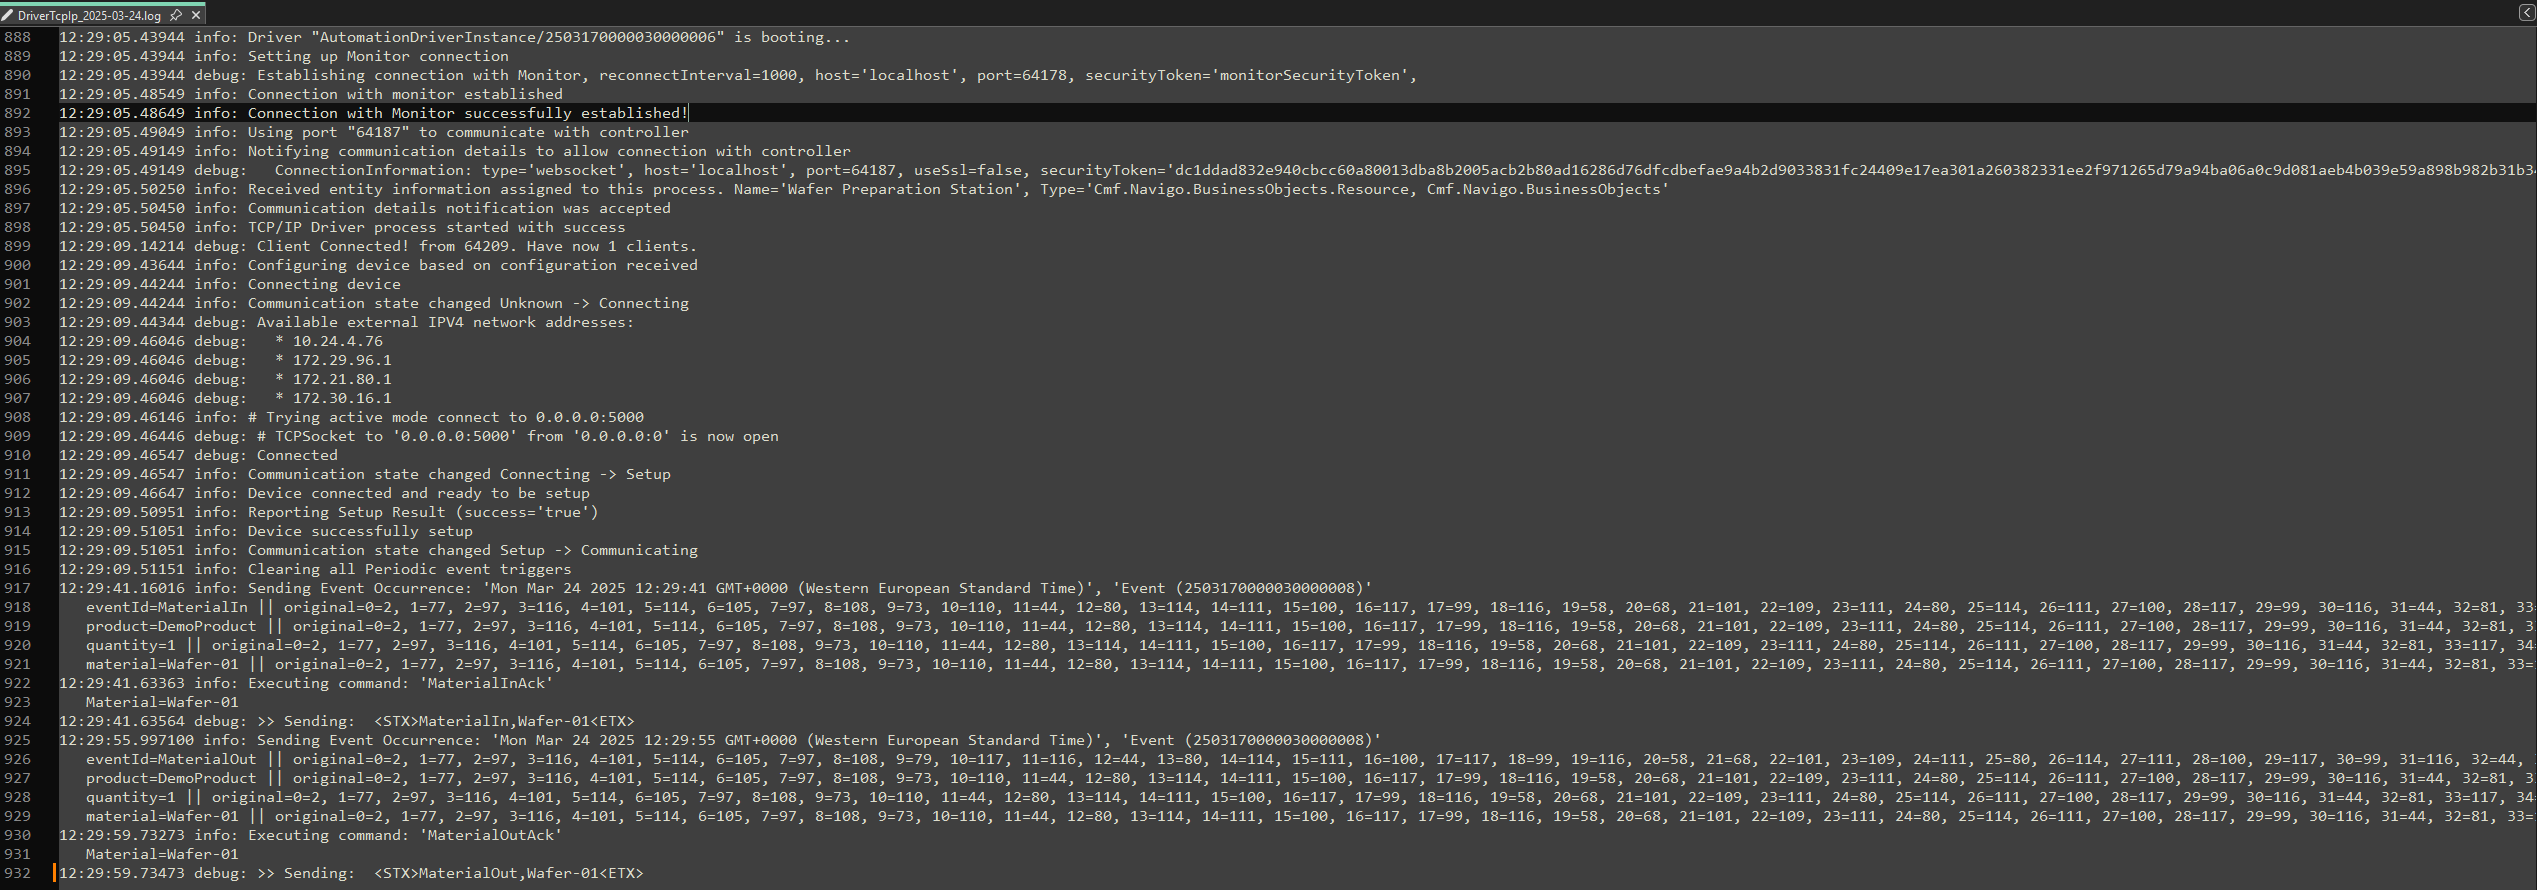
We can see how helpful it can be for troubleshooting to have this segmentation by component. In the driver the user can expect to see all the information regarding the communication layer, for example are all the ports open, are the events and commands registered. Whereas, in the controller we see information related to our integration and business logic.
State Change#
Another scenario is when there is a temperature or humidity above a particular threshold. For this one we will use the MQTT protocol.
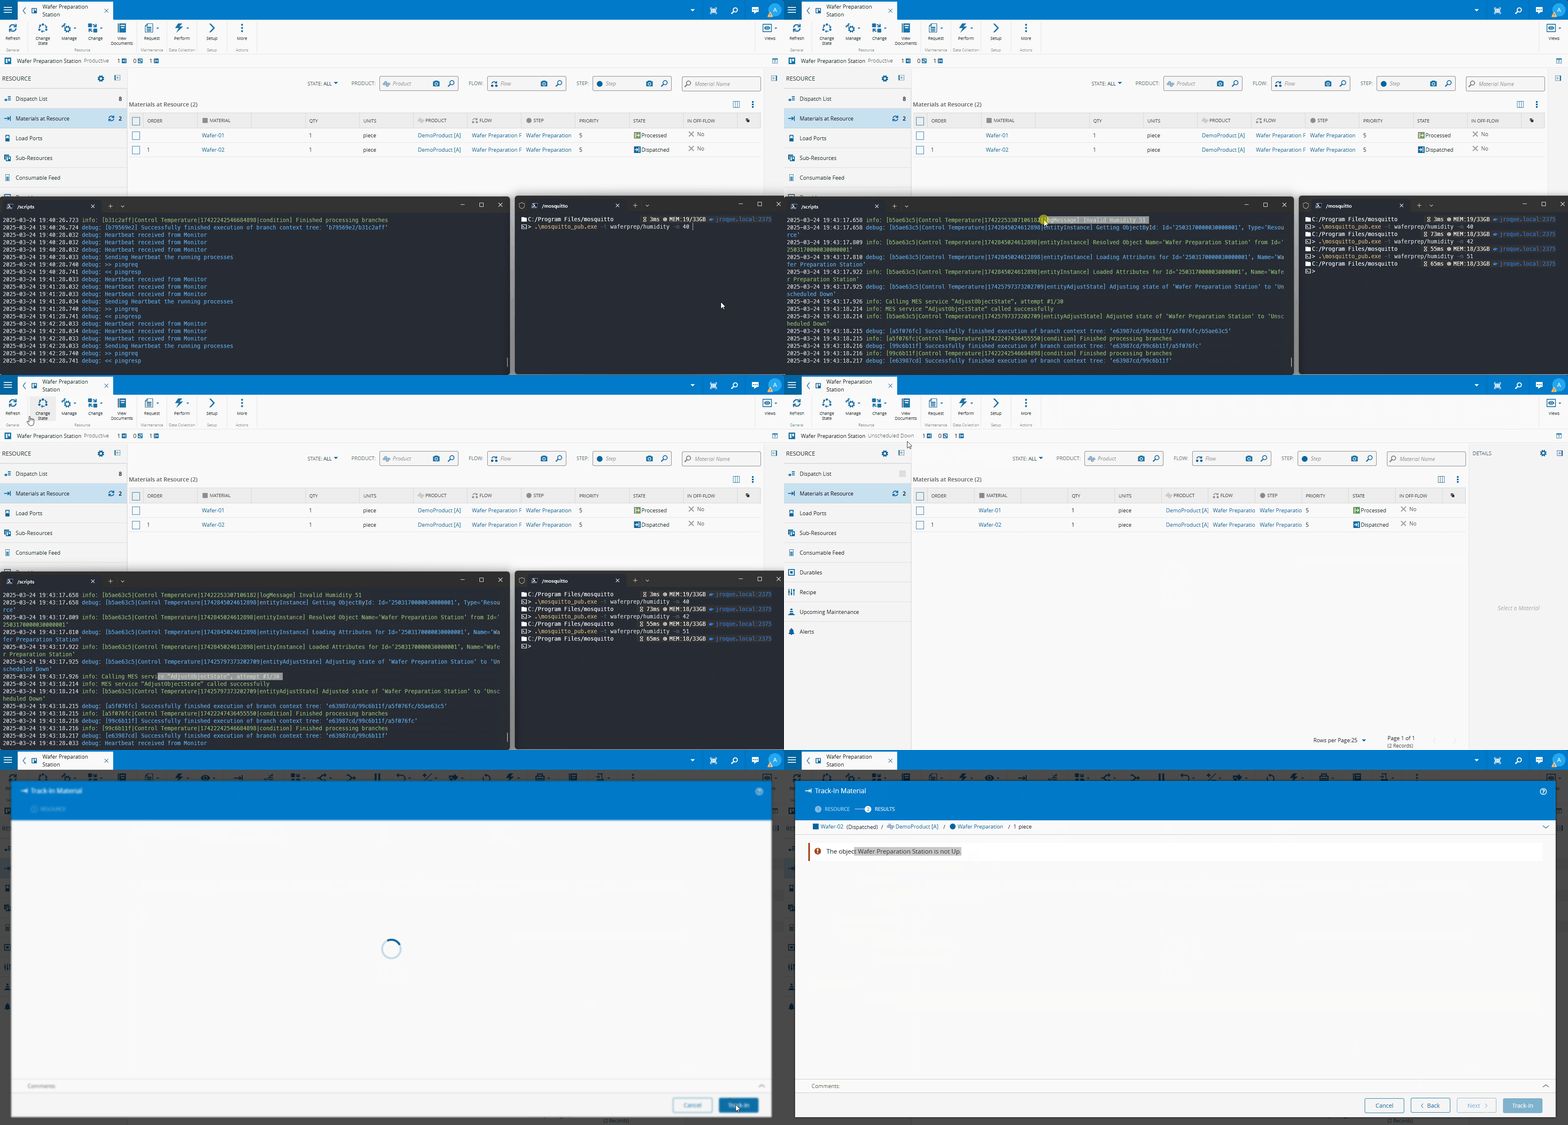
When a machine has an invalid state to produce like Unscheduled Down, the MES prevents work from being done to the material.
If we try to track in or out using our tcp-ip integration the MES will give an error and not send an acknowledgment message.
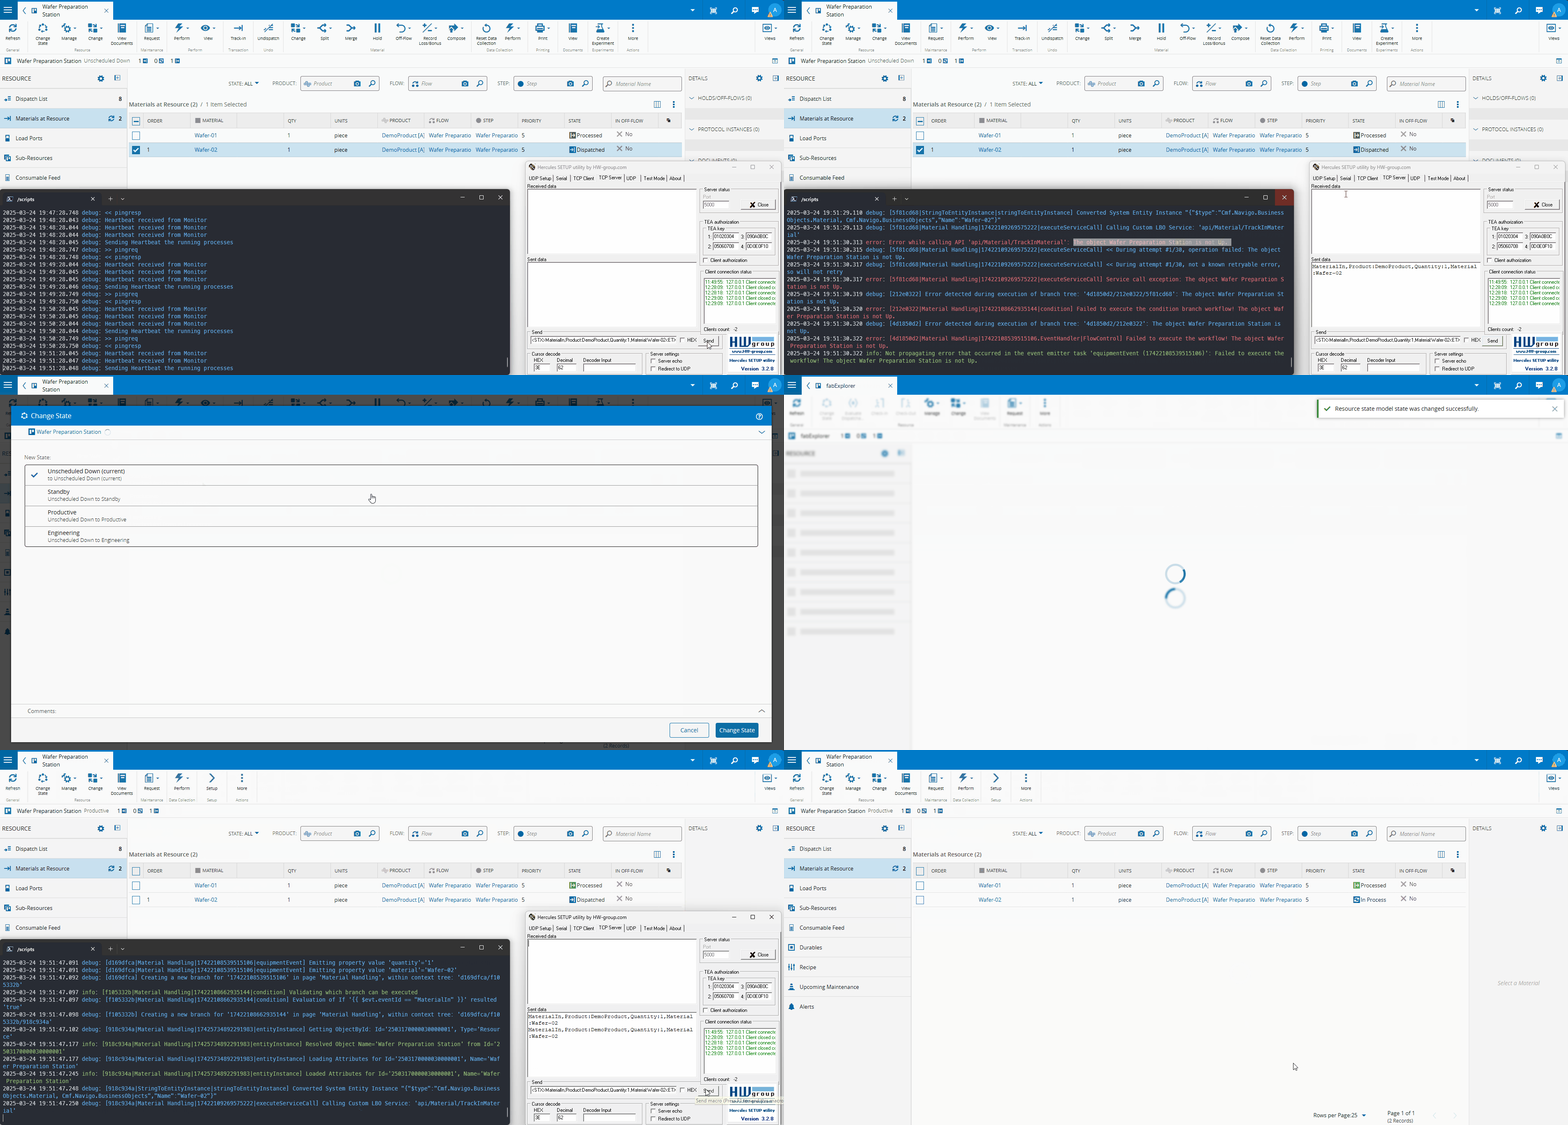
State Change - Logging Files#
If we investigate our logging files, we can see that our driver has no errors.

In the Controller, where we have our business logic, we can now see in detail what has occurred.
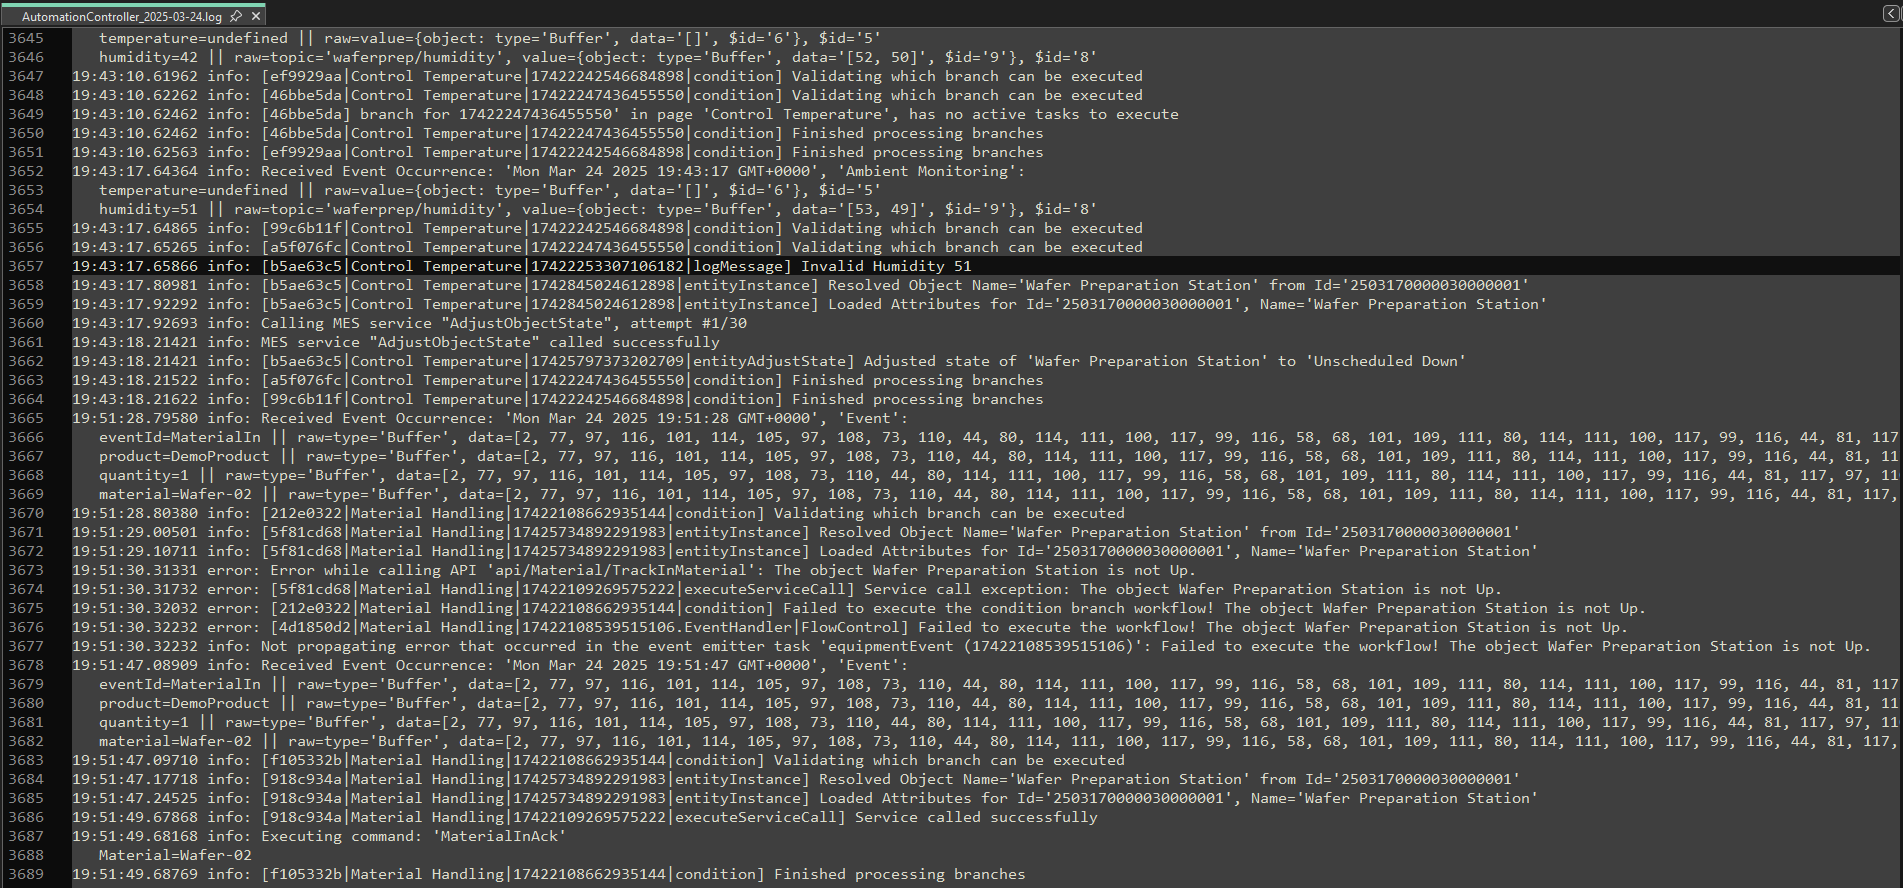
We have our mqtt driver changing temperatures and we have our MES request failure, showcasing that the material cannot be tracked in as the Resource is in an invalid state.
Observability#
One of the issues of on edge devices is centralized visibility on everything that happens. This is may not be major problem (it still is 😉) if all your devices run in the same kubernetes cluster and everything is one click away or one log tool away, but for automation that is not enough. Reading file logs is also a very cumbersome and static post factum analysis.
This is why we launched our observability platform.
Observability - Automation#
Let’s see the difference.
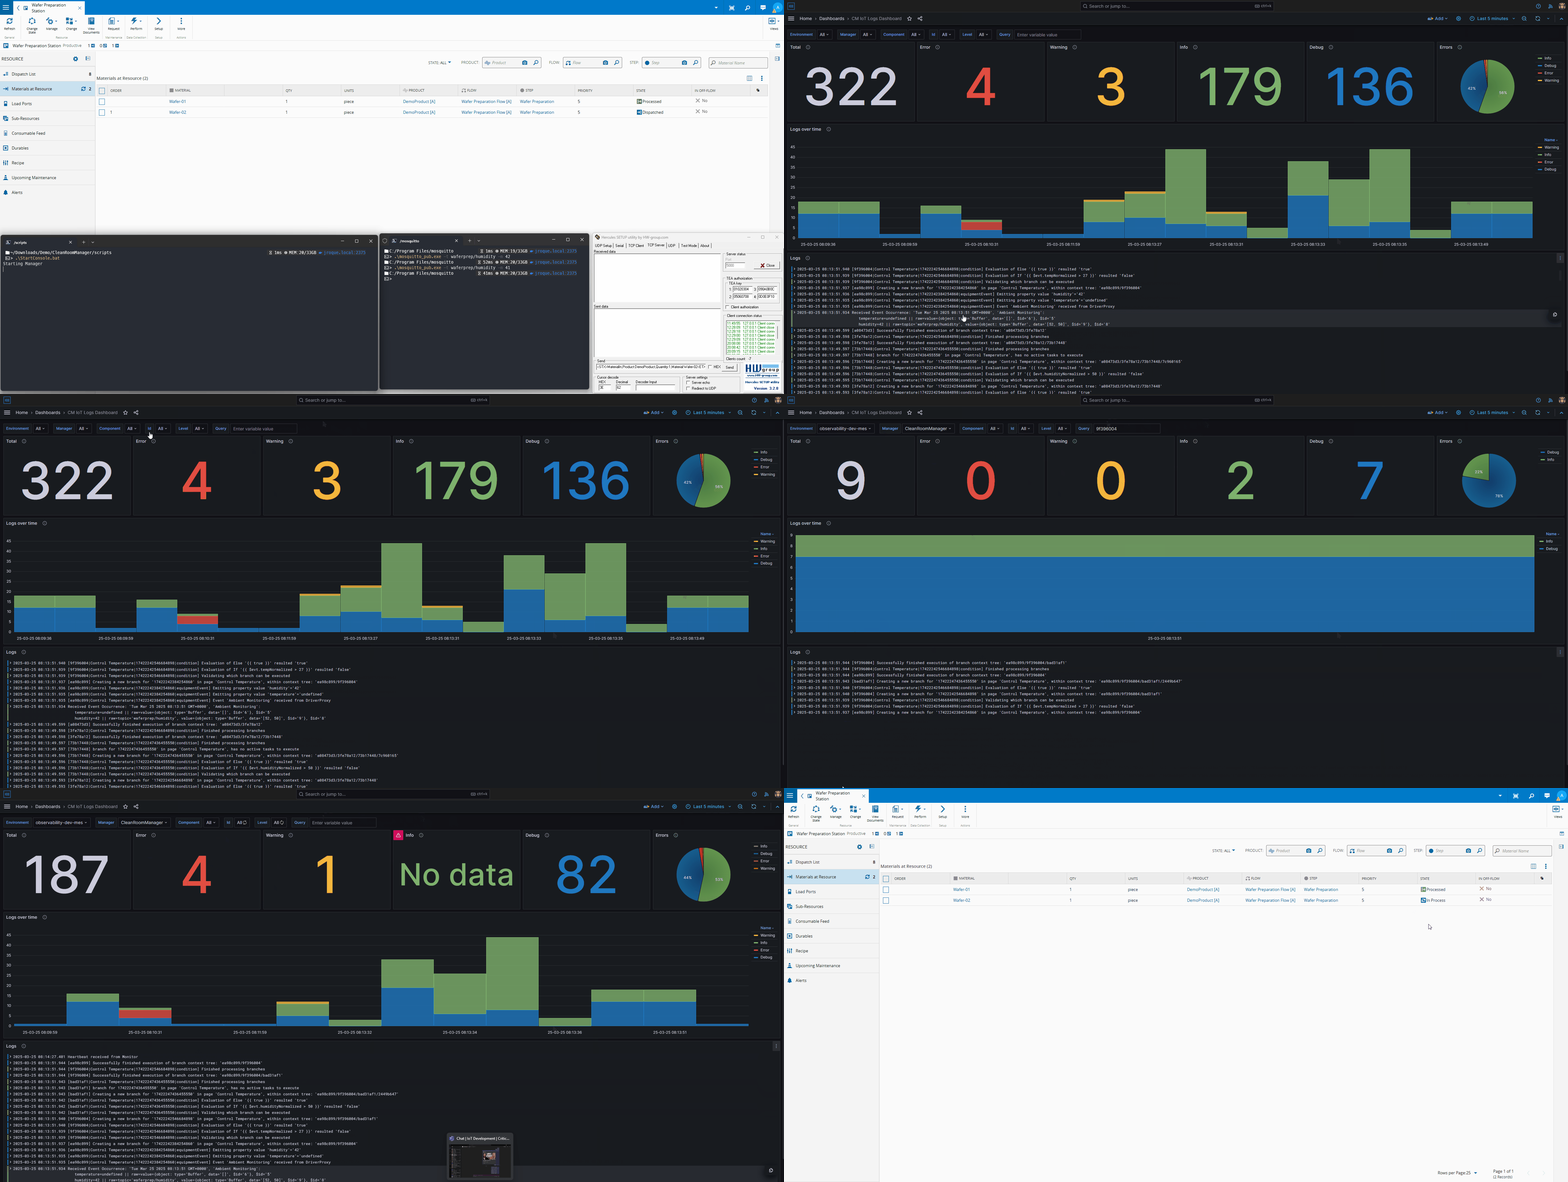
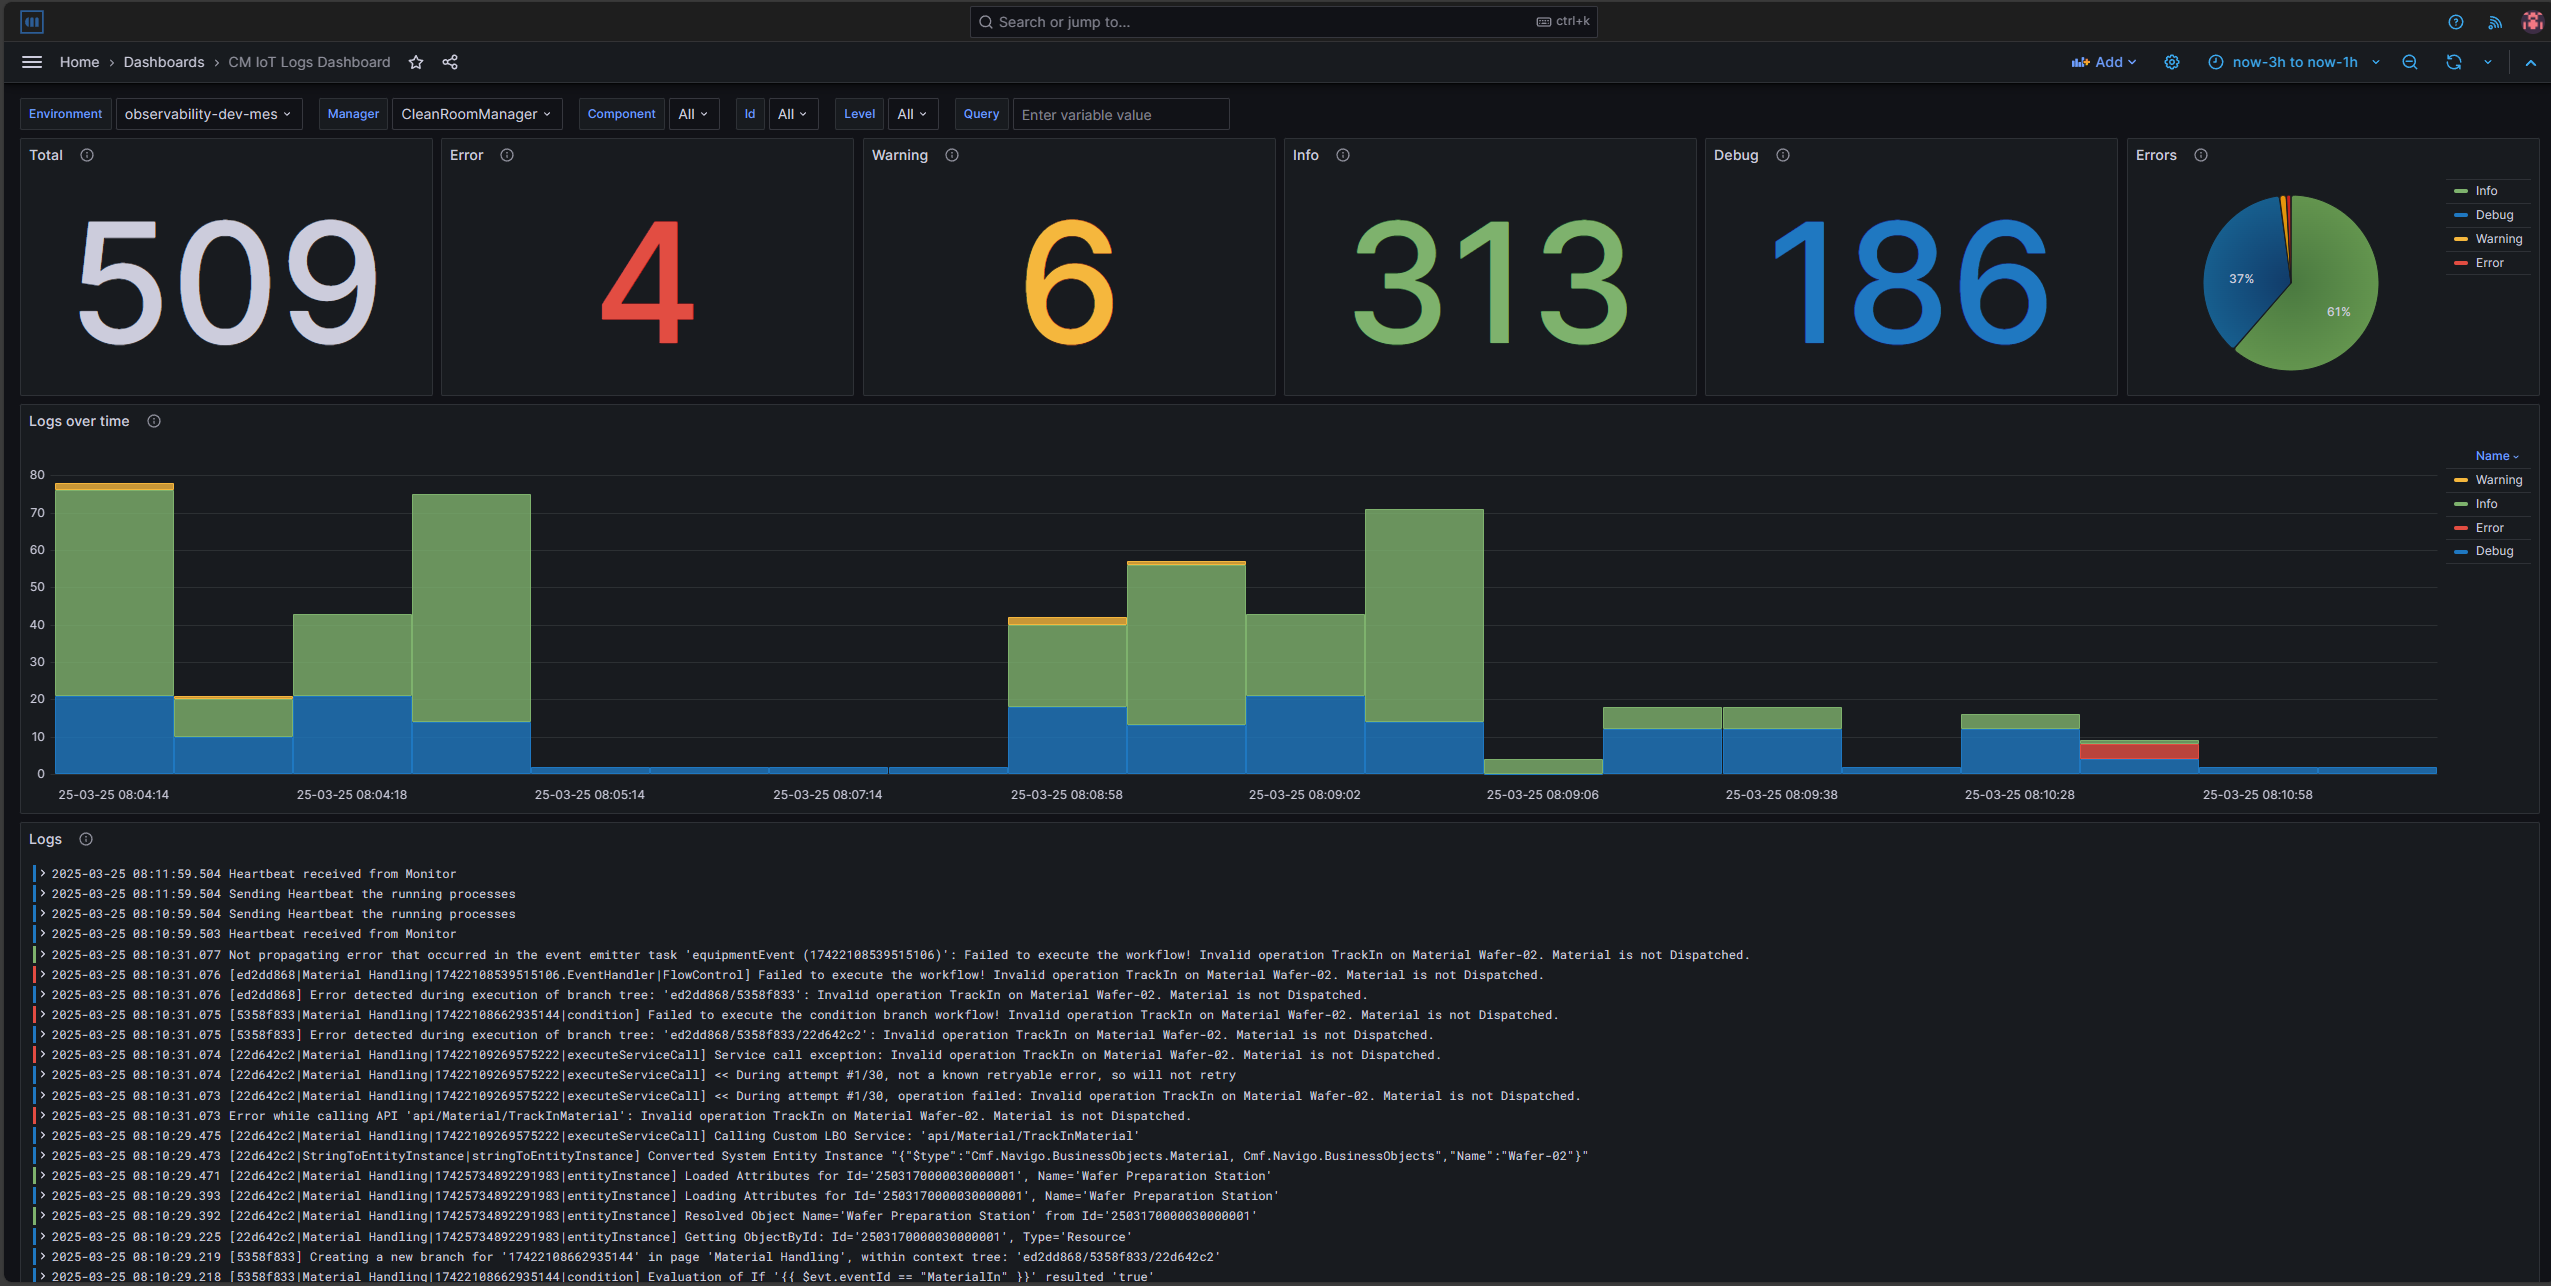
We are now seeing remotely everything that is happening on our Connect IoT application. Not only that, but we are able to provide filters from Environment, to Manager, to Component. This way we can pinpoint what part of our components is causing us issues. We can also perform custom queries to filter the data. All of this is dynamic and in near realtime. We can also perform macro analysis of a system by understanding our ration of how many messages have what verbosity and what are the ration between them. In my use case I had already some error and warning messages. We can also adjust the time window as we wish, for this scenario we were interested in the latest messages, but we could filter for a particular timestamp where we know something unexpected happened in the shopfloor.
Observability - BackEnd#
Of course, observability is not only about automation. All components of the MES are represented in a dashboard, some of them even have specific dashboards.
Let’s backtrace the actions we performed from the perspective of our backend application. One of the services we used was the TrackInMaterial.
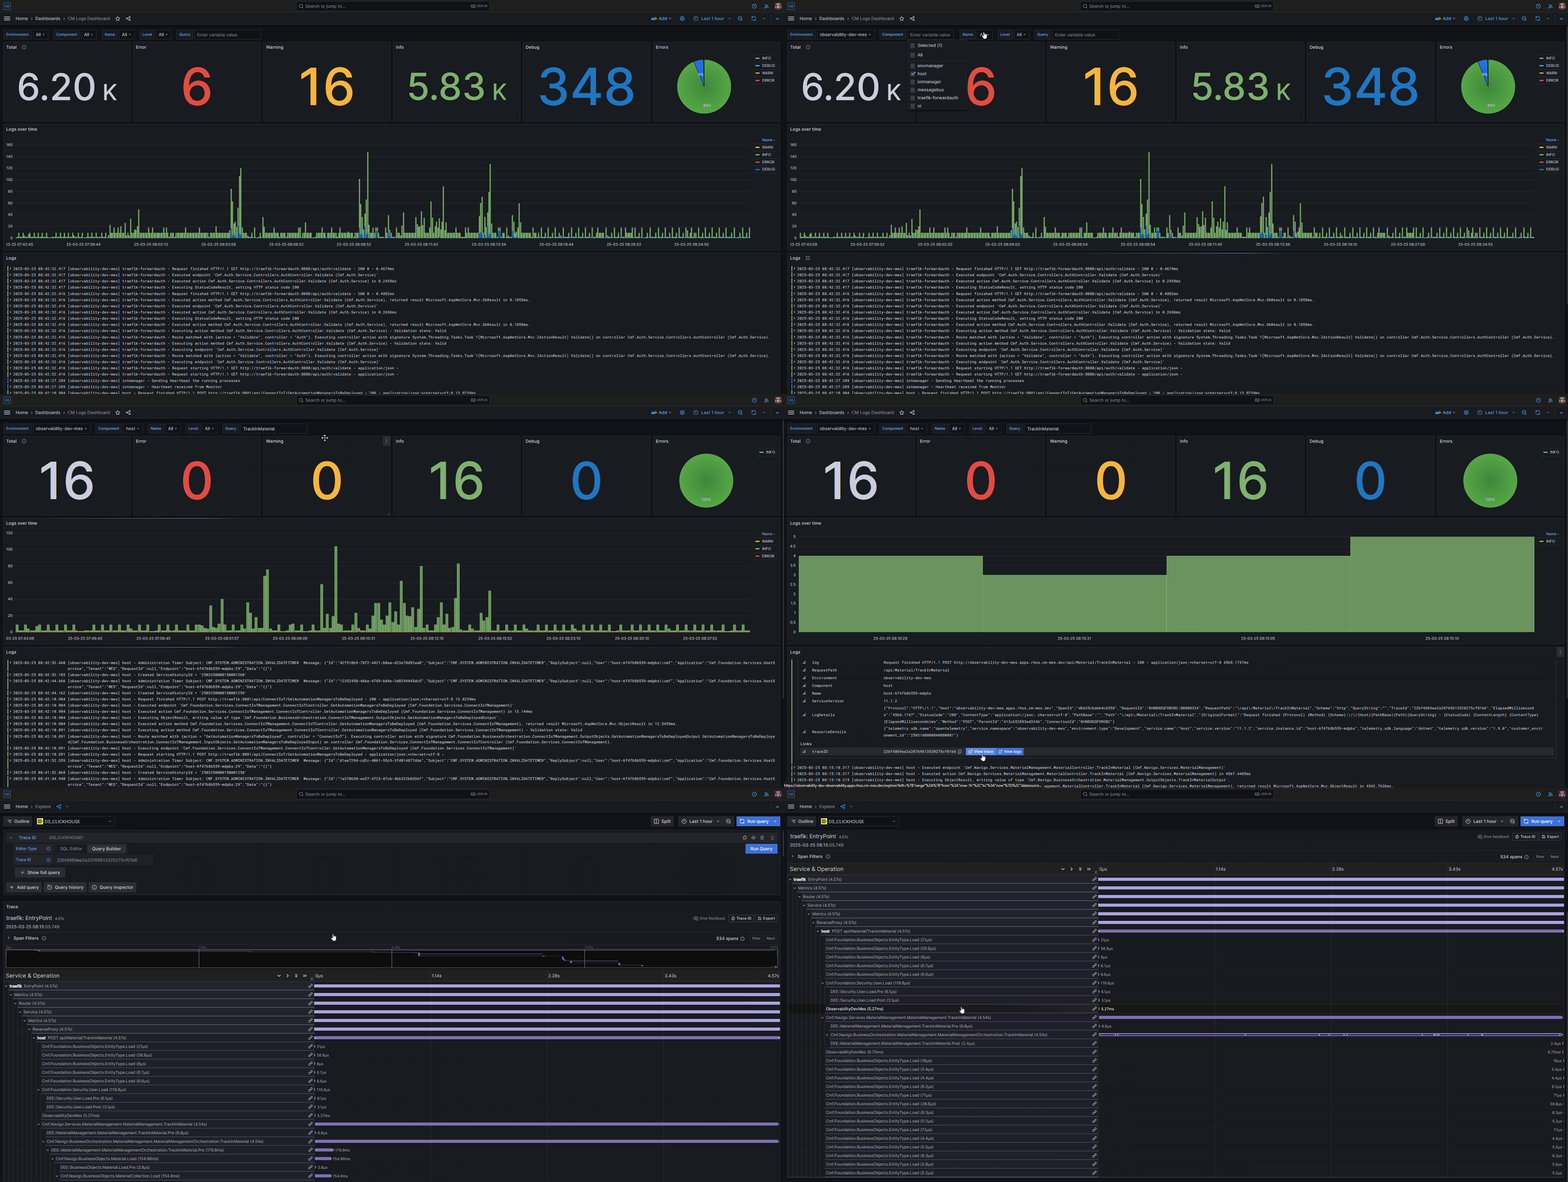
We are able to have multiple Environments being tracked at the same time. We can then filter by component, in our use case we were interested in the backend execution of the service, so we filtered by host and then search for TrackInMaterial. After finding our service call, we can then see the logs just for that transaction and even see a trace view. We can see everything our service is executing and how much time we are spending in each action.
It is also very helpful to bring visibility to errors. Let’s see what the error scenario of trying to perform track in of a material to a Resource looks like.
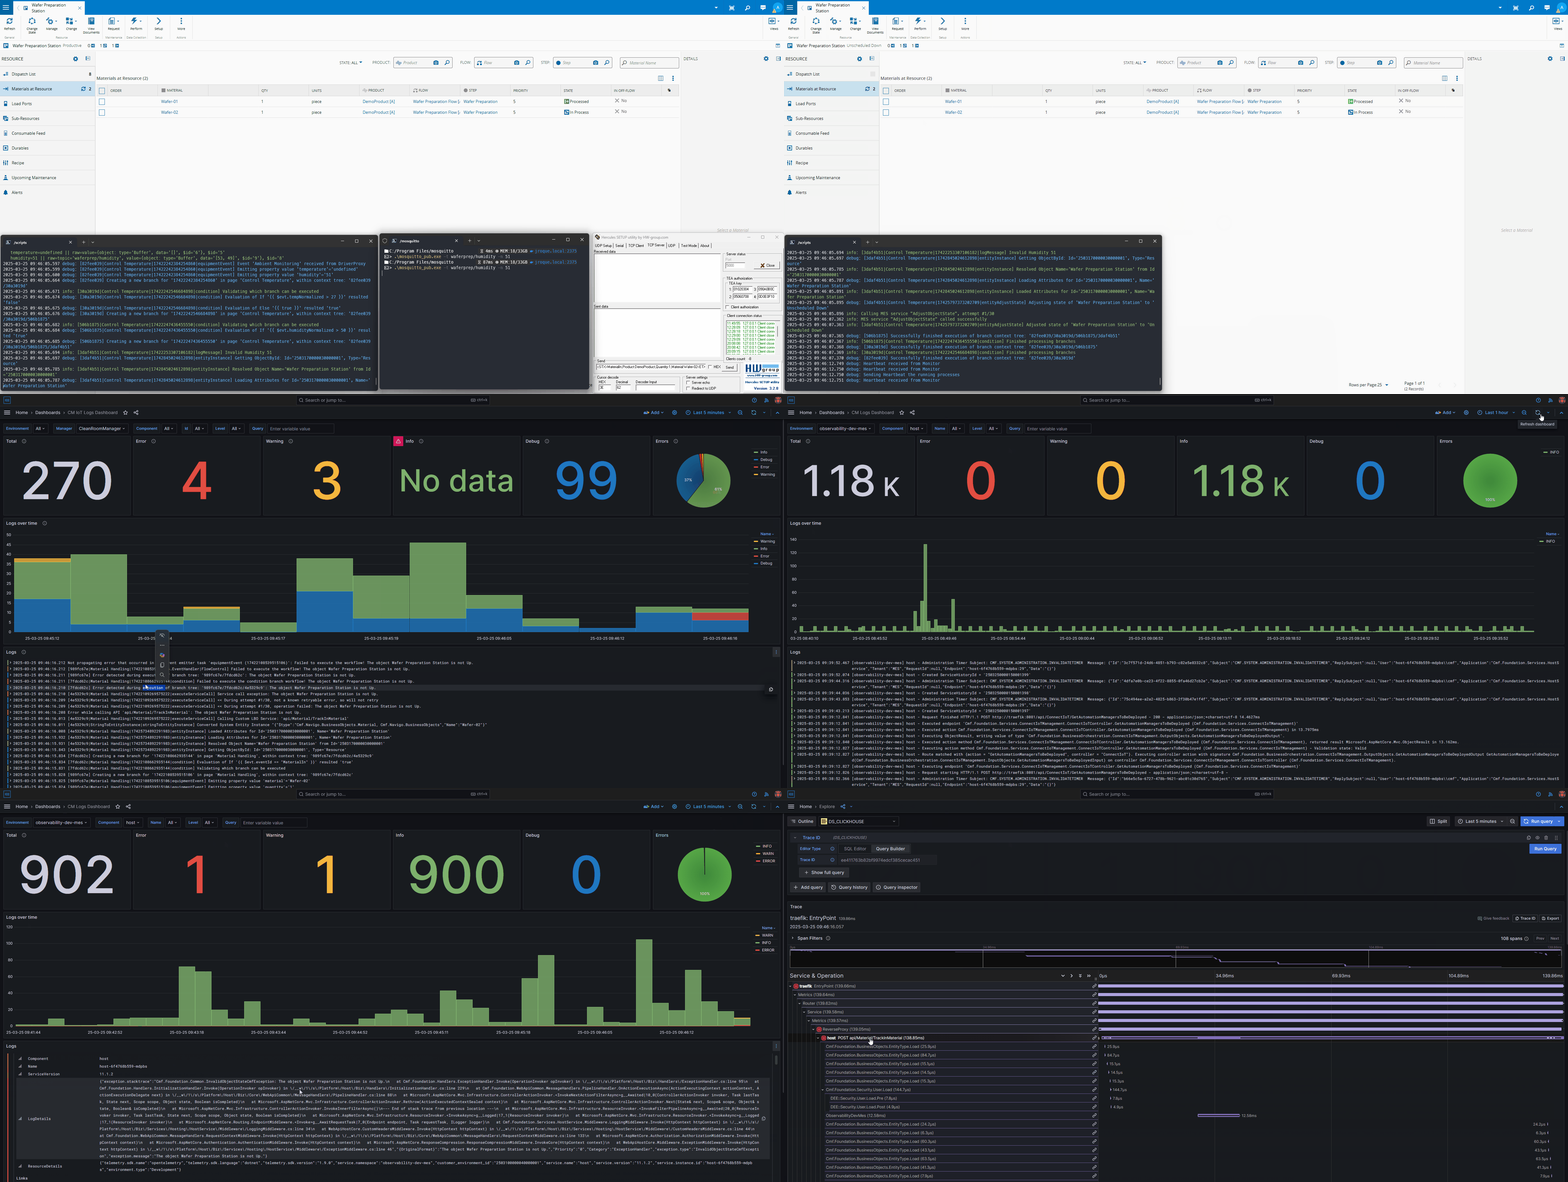
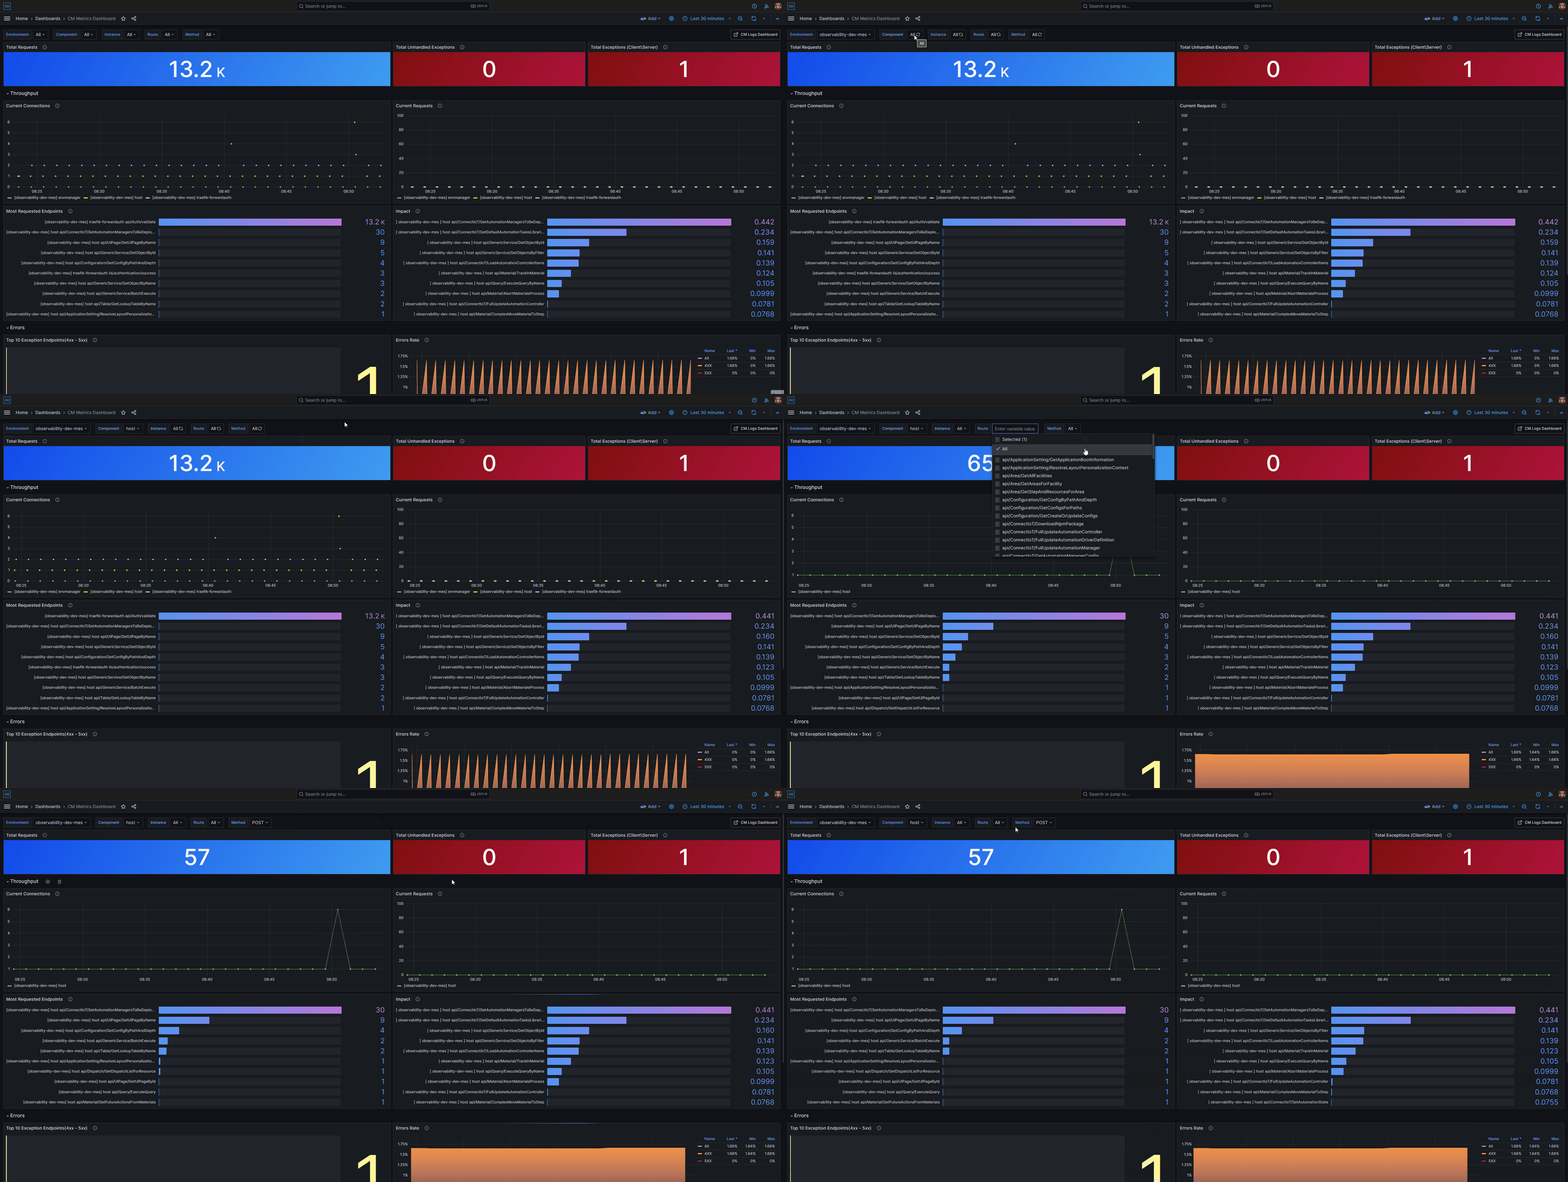
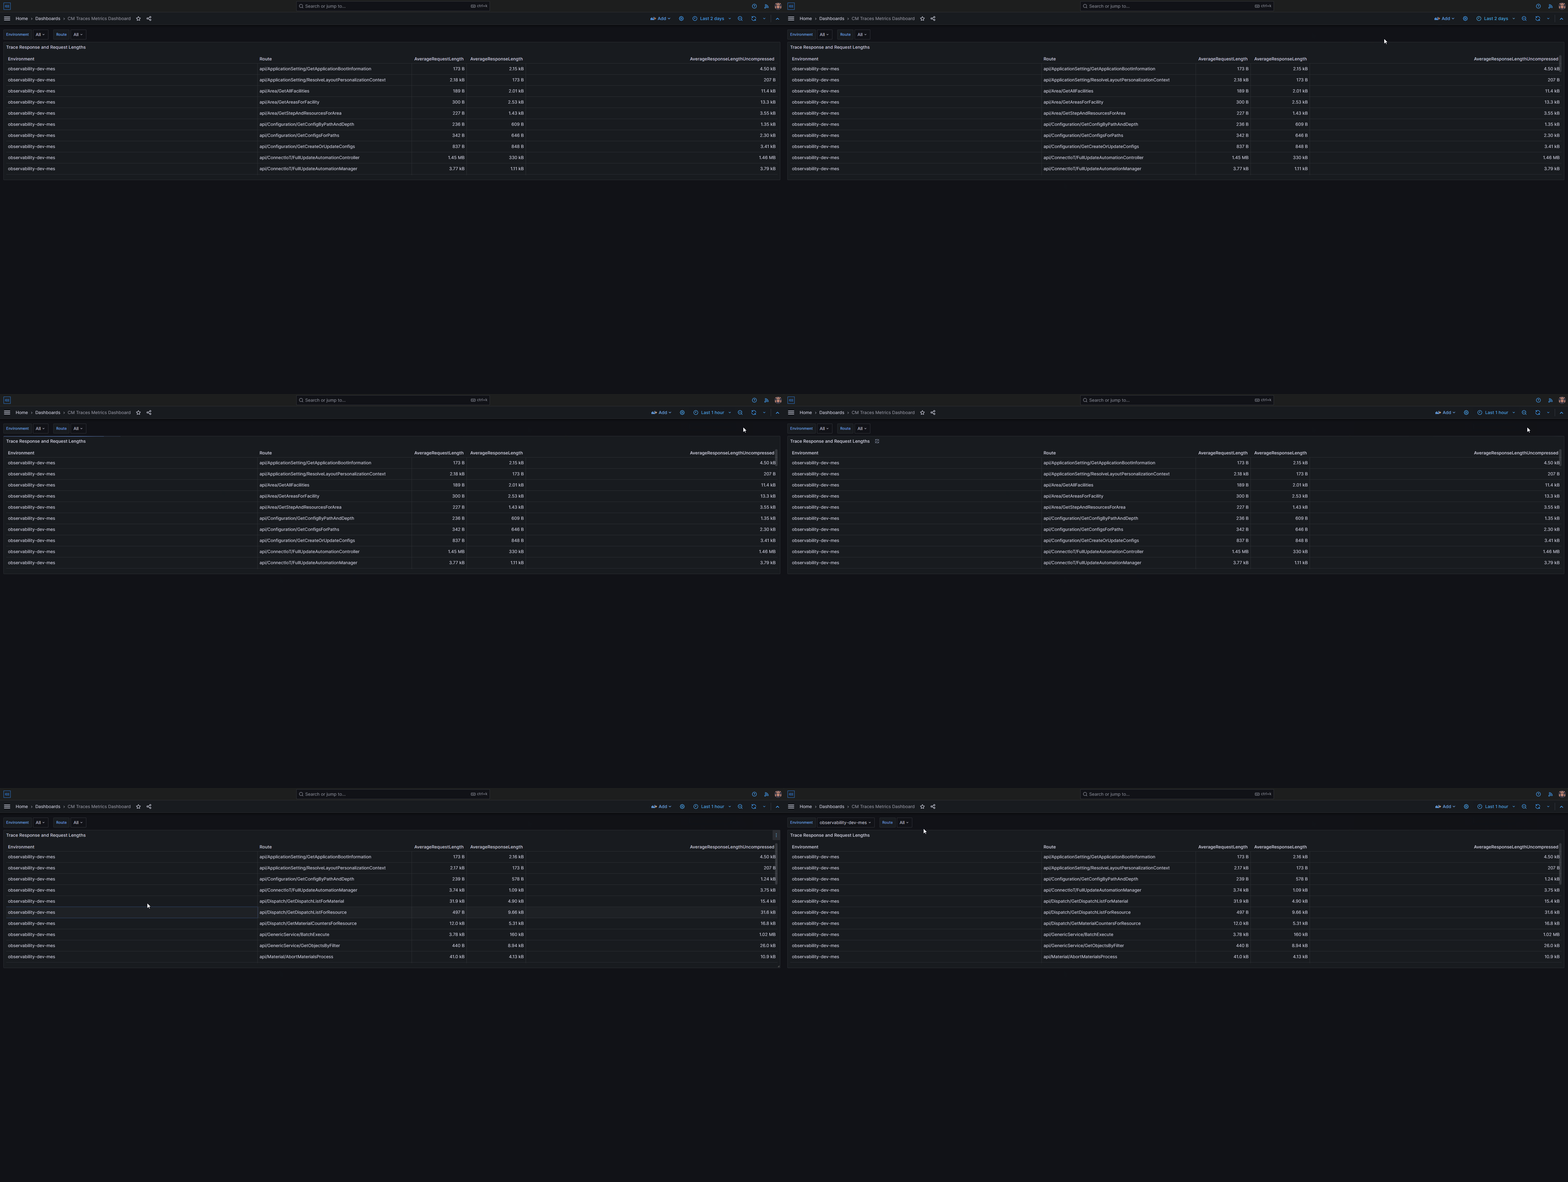
We also have aggregated dashboards where we can see which are the most requested endpoints and the ones that take the most time.
Observability - FrontEnd#
One of the interesting dashboards we also have is the one that tracks user interactions with the user interface.
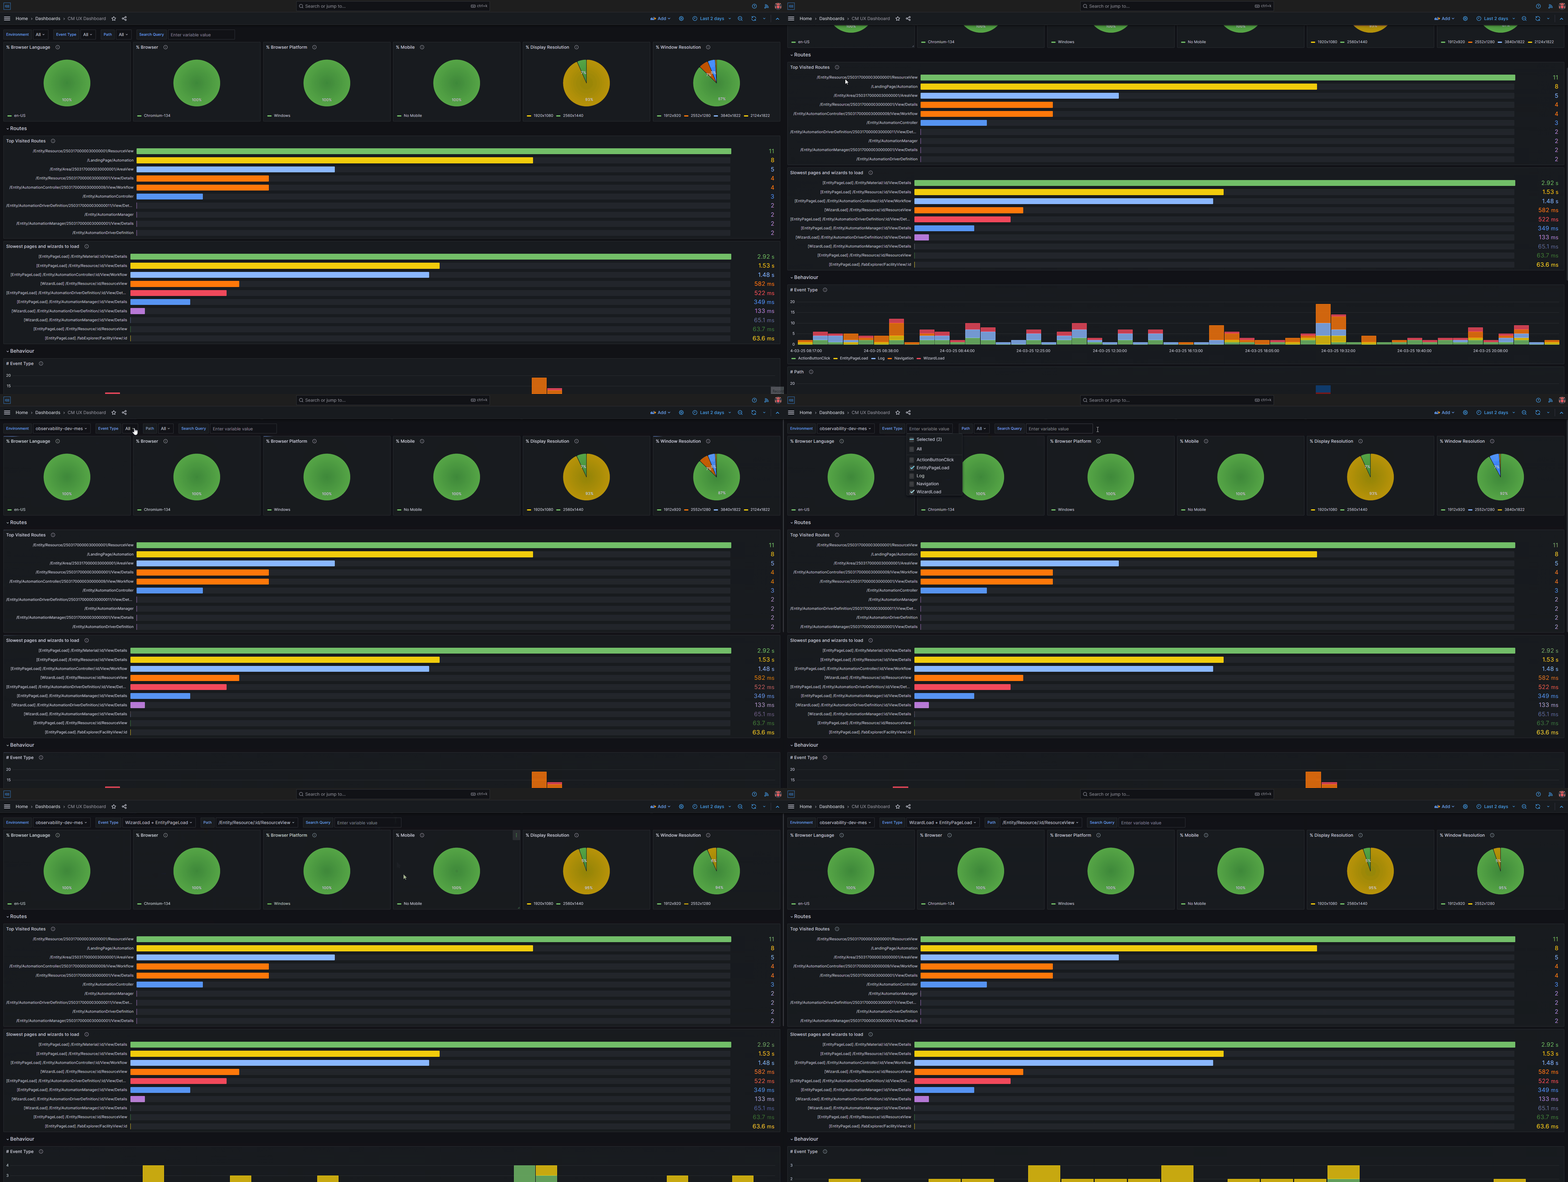
Throughout our use case the UI we traversed more was the view from the Resource. We can see that the material page is the Ui that took more time. This is very important to understand the health of the system and to understand if user perceived unresponsiveness comes from the frontend, backend or if it’s just a perception and to troubleshoot what are the pages that could be optimized.
We can also see that I accessed the MES both from a 1080p monitor and 2k monitor. This is interesting information to understand what are the type of users for our dashboards. If for example, most of the users use mobile or use a specific screen size, the UIs can be optimized to be more responsive to those screen sizes.
Summary#
There are many more dashboards and views in our Observability module, but I think it is easy to see the immense benefit of having a centralized platform where you can see everything that is happening in your several MES environments.
Thank you for reading !!!
